Power Patterns: Understanding the Energy Dynamics of I/O for Parallel Storage Configurations
Powering Through Data: Energy Insights for Parallel Storage Systems
- Sept. 30, 2024 by
- Maya Purohit
As high performance computing (HPC) applications become more I/O intensive, understanding their power consumption patterns is necessary to develop energy-saving solutions. In our research project, we evaluated the energy consumption of I/O operations on two popular HPC parallel file systems: Lustre and DAOS. We developed models to predict the energy usage of sequential writes and evaluated their accuracy against our gathered benchmarks. Our models can be used to enhance the accuracy of energy-predicting frameworks by allowing them to consider storage configuration when estimating total energy consumption.
Research Overview
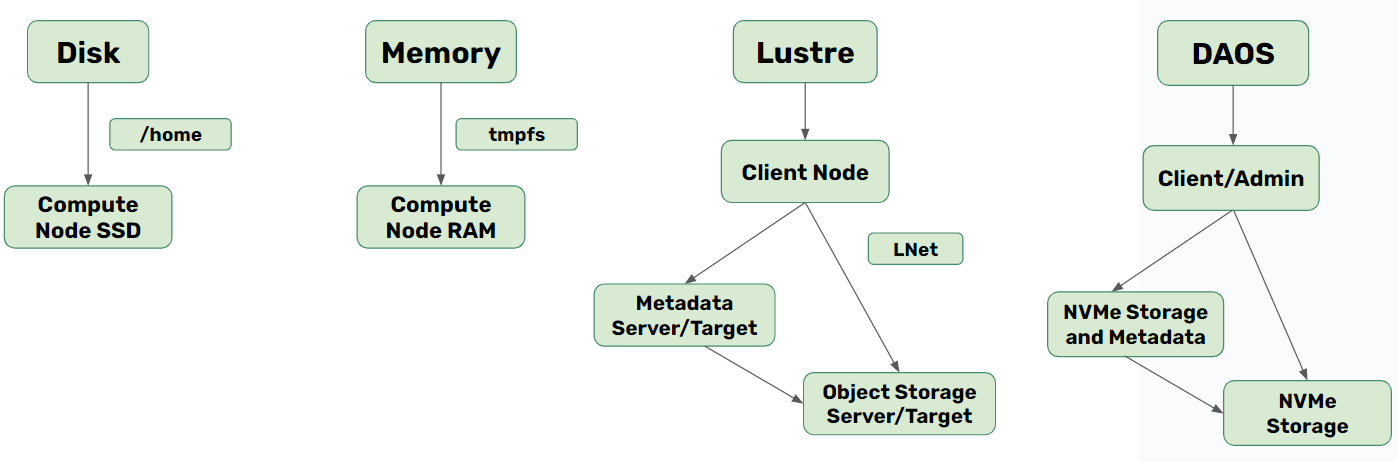
Figure 1 displays a diagram representing the four different local and remote storage configurations we utilized and implemented for this research project. Typically, a parallel file system contains three different types of machines: the client node which allows for user interaction, the metadata node which stores data regarding file location, permissions, etc., and the storage nodes which hold the data itself. In our configurations, both file systems contained three nodes representing each type of machine.
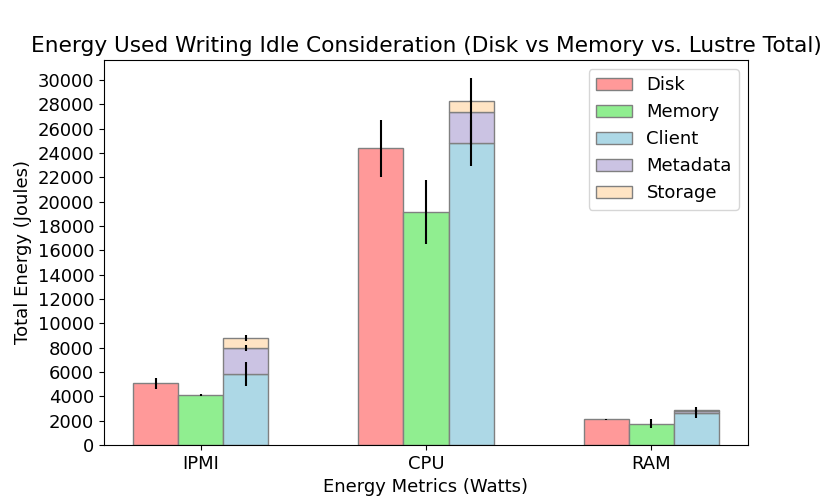
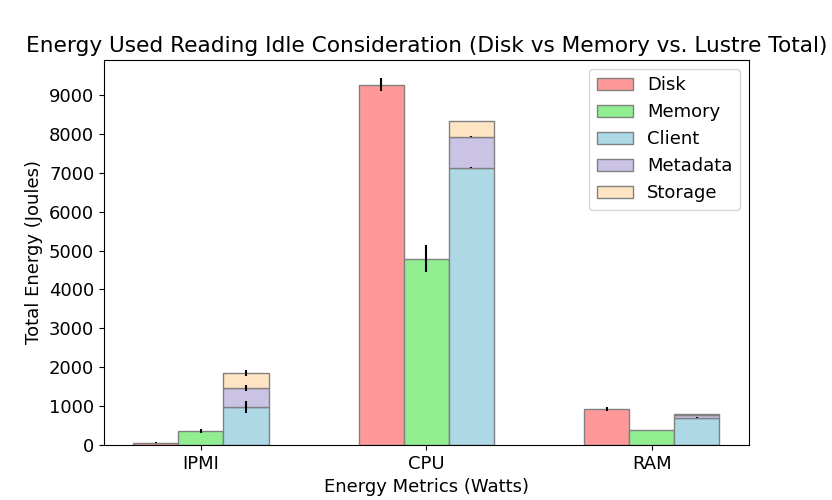
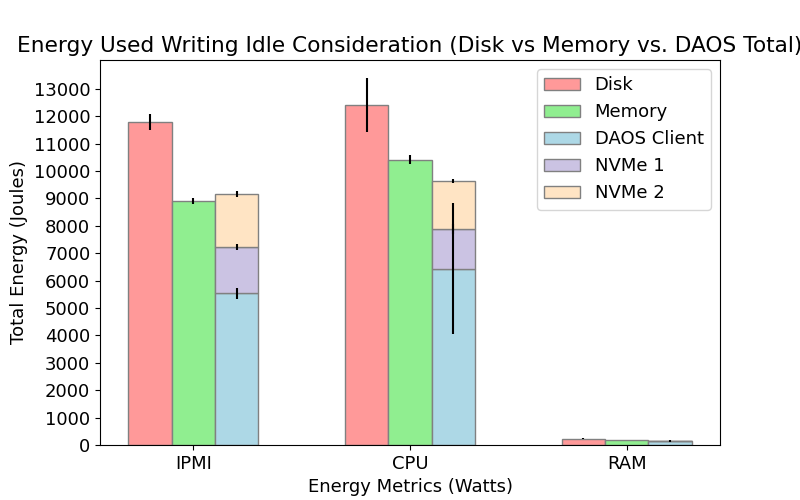
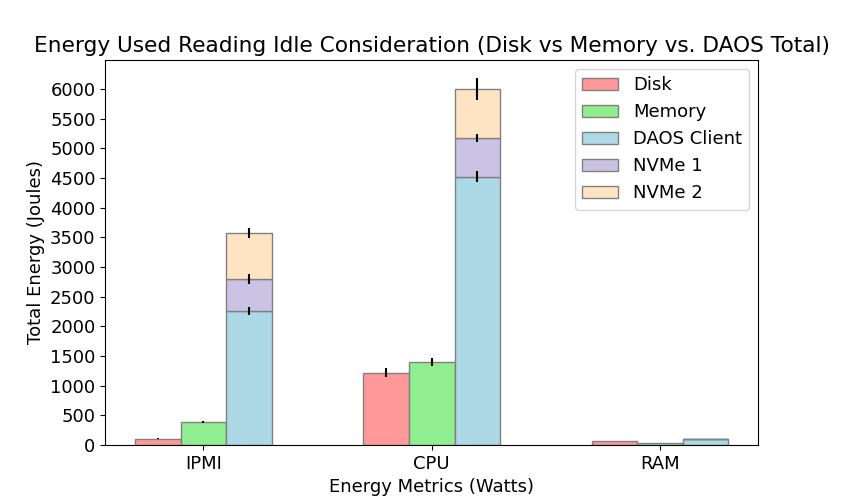
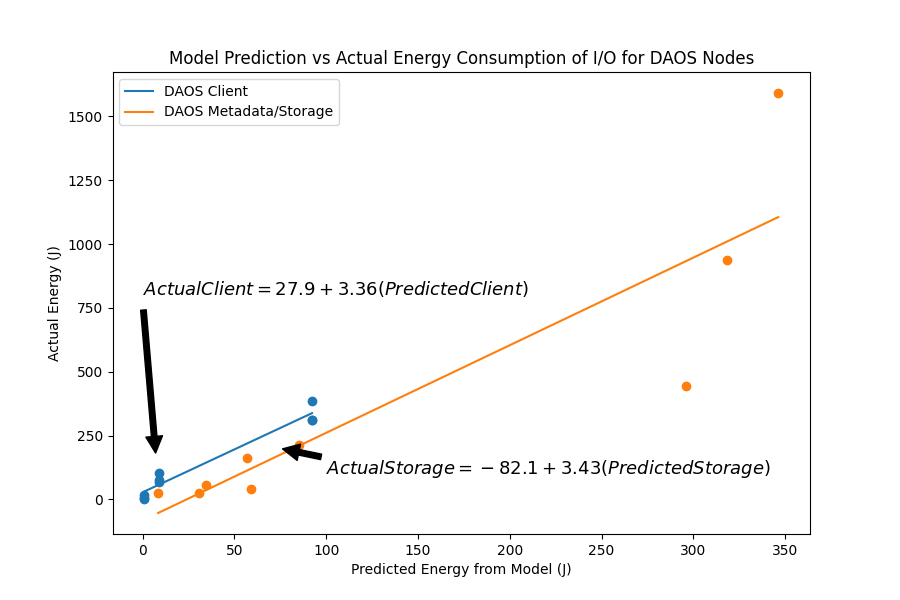
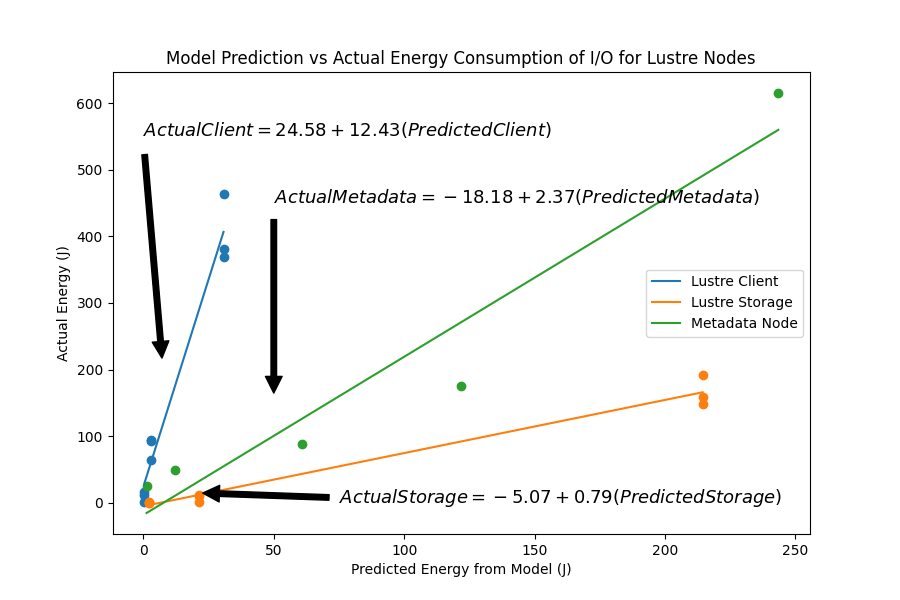
We measured the IPMI, CPU, and RAM power consumption for each node in Lustre and DAOS when performing I/O operations (writing and reading) and compared their energy performance to permanent (Disk) and temporary (Memory) local storage configurations. The results are shown below in Figures 2 and 3. We found there to be a statistically significant difference in energy consumption between Disk, Memory and Lustre for both reading and writing. In contrast, energy consumption in DAOS is comparable to Memory when writing but significantly different than Disk and Memory when reading. We also modeled total energy consumption for each individual node in Lustre and DAOS when writing. Although there is a strong linear relationship between the model prediction and observed values, our current models typically overestimate total energy. For more detail on our model design, please refer to the poster and write-up linked below.
Our research demonstrates that the energy consumption of I/O operations can vary significantly depending on the parallel file system and storage configuration used. By understanding these energy dynamics and utilizing energy-efficient solutions like DAOS, HPC facilities can reduce their environmental impact and operational costs, while also potentially improving system performance.
Experimental Implementation on Chameleon
We deployed Lustre and DAOS on bare-metal nodes in the Chameleon Cloud. The bare metal nodes allowed us to ensure that we recorded only energy measurements for the I/O tasks we intended to benchmark. Our Lustre deployment had one Client Node, one Metadata Server/Target (MDS/T) with one 223.6GB SSD and one Object Storage Server/Target (OSS/T) with 16 2TB SSDs. For DAOS, we deployed one Client/Admin Node with one 447.1GB SSD and two DAOS Storage Server nodes with 15TB of NVMe storage.
Since both Lustre and DAOS require multiple machines with particular attributes to be implemented, the hardware catalog and the host availability browser were incredibly helpful throughout the planning process. The detailed information regarding storage capacity and networking capabilities for the compute and storage nodes in the Chameleon testbed were crucial for our research project. Specifically for DAOS, our original implementation required storage machines with Optane Persistent Memory, NVMe storage, and Infiniband capabilities. The hardware catalog helped us find the compute and storage nodes that met our specific needs.
To gather power metrics for each node in Lustre and DAOS when performing I/O intensive tasks, we heavily utilized the command line and bash scripts. We measured total, CPU, and RAM power consumption using the Running Average Power Limit (RAPL - A feature that provides fine-grained energy usage information for CPU and memory) interface on Intel machines and the Intelligence Platform Management Interface (IPMI - A standardized system interface for monitoring hardware) from the Baseboard Management Controller (BMC - A specialized microcontroller that manages the interface between system management software and platform hardware). This Chameleon blog post provided us with multiple resources to access and gather total power metrics on Chameleon machines, significantly improving the data we were able to collect.
To implement Lustre, we needed to install kernel versions and packages that were compatible with the latest version of Lustre that has been released. Chameleon's custom kernel boot was incredibly important for implementing a functional version of Lustre for energy benchmarking. Additionally, the support the Chameleon testbed has for infiniband will be helpful for our research project as we look to expand from using ethernet to Infiniband for the DAOS file system.
Experiment Artifacts
This research poster was accepted into the SC24 ACM Undergraduate Poster Competition.
User Interview

Tell us a little bit about yourself
I am currently an undergraduate junior at Colby College partaking in the Dual Degree Engineering program at Dartmouth College. I am majoring in Computer Science and Engineering with a minor in Mathematics. After earning my bachelor's degree, I would like to pursue graduate school. In my freetime, I like to learn new recipes to cook and play tennis!
Most powerful piece of advice for students beginning research or finding a new research project?
It may seem obvious, but I think it is important to be patient with yourself. When I first started this research project, I naively thought that the questions we were trying to answer would have clear and neat solutions. I found myself feeling discouraged when the results did not fit with our intuitive understanding of the file systems we were testing. However, after witnessing my mentor and the other researchers around me approach difficult problems with resilience and persistence, I learned that I needed to readjust my mindset. Approach research with patience and open-mindedness.
Why did you choose this direction of research?
At the start of the summer, I did not have a specific research direction in mind. I did not have any prior professional or academic experience working with computer systems, so I viewed this research project as a great opportunity to immerse myself deeply in the field and see if it interested me. With guidance and support from my mentor, I was able to broaden my understanding of system administration and the different disciplines associated with computer science.
Thank you for sharing your knowledge with the Chameleon community!
Power Measurement and Management on Chameleon
Exploring Power Monitoring Techniques with RAPL, DCMI, and Scaphandre
- June 18, 2024 by
- Michael Sherman
Monitoring power consumption is crucial for understanding the energy efficiency of your applications and systems. In this post, we explore various techniques for measuring power usage on Chameleon nodes, including leveraging Intel's RAPL interface for fine-grained CPU and memory power data, utilizing IPMI's DCMI commands for system-level power information, and employing the Scaphandre tool for detailed per-process power monitoring and visualization. We provide practical examples and step-by-step instructions to help you get started with power measurement on Chameleon, enabling you to gain valuable insights into the energy footprint of your workloads.
Maximizing Performance in Distributed Systems with a Power Budget
- Oct. 15, 2019 by
- Huazhe Zhang
One challenge for power budgeting systems is how to power cap dependent applications for high performance. Existing approaches, however, have major limitations. Our work proposes a hierarchical, distributed, dynamic power management system for dependent applications.
Power to People: Monitoring Power Consumption of Low Power Nodes
- June 22, 2018 by
- Joe Stubbs
Did you ever wonder how much power was consumed by executing a program? The Chameleon team recently implemented a feature that automatically collects power usage data on all low power nodes in the system. Instantaneous power usage data (in watts) are collected through the IPMI interface on the chassis controller for the nodes. This “out-of-band” approach does not consume additional power on the node itself and runs even when the node is powered off. Low power nodes for which power usage data are now being collected include all Intel Atoms, low power Xeons, and ARM64s. In this blog post we look at this new feature and use it to calculate the power consumption associated with multiplying two large Python numpy arrays.
No comments