Power Measurement and Management on Chameleon
Exploring Power Monitoring Techniques with RAPL, DCMI, and Scaphandre
- June 18, 2024 by
- Michael Sherman

A common question we get is "how can I see how much power my node is using?" Because the node is sitting in one of Chameleon's Datacenters, we can't just plug it into a smart outlet and watch what it draws (There are smart PDUs on the market, we just don't have them right now).
However, all of our "server-class" nodes make this information available to the operating system, and we can get at this information in a few ways. The Intel RAPL (Running Average Power Limit Energy Reporting) framework has the CPU self-report information about the joules used by each processor, and by other subsystems, such as memory.
The "baseboard management controller (BMC)" on each system may also provide information from the power supplies, this can be useful for getting a total system level measurement including fans, cooling, and other overhead.
Getting system-level power information from the BMC
Most "normal" Chameleon bare metal nodes support IPMI and the "Data Center Manageability Interface (DCMI)". This includes all of the Intel and AMD based compute_ and gpu_ nodes. Some special case nodes like FPGAs and arm64 do not support this, as the vendor didn't implement the interface.
sudo apt install freeipmi-tools
sudo ipmi-dcmi --get-system-power-statistics
Current Power                        : 226 Watts
Minimum Power over sampling duration : 0 watts
Maximum Power over sampling duration : 650 watts
Average Power over sampling duration : 236 watts
Time Stamp                           : 06/18/2024 - 16:49:22
Statistics reporting time period     : 1000 milliseconds
Power Measurement                    : Active
This data is generally accurate, but doesn't update very frequently (usually several seconds at the fastest). It's most useful for logging power data over hours to days.
RAPL: Getting information from the CPU
Intel's RAPL makes information available via several registers, including MSR_PKG_Energy_Status and MSR_PP0_Energy_Status, which update on the order of milliseconds. This makes information available with a much finer time resolution than from the BMC, but it is not "complete", generally only including power usage from the CPU and Memory subsystems.
Rather than write code to query these interfaces directly, we'll leverage some existing tools to get at the data.
A simple example with Perf
For more detailed and timely information, we can query the CPU using the RAPL interface. This information is updated on the order of milliseconds, although we are limited by the overhead of querying it.
First, for a simple example with "perf":
# install linux-tools for your running kernel, to get the `perf` tool
sudo apt-get install "linux-tools-$(uname -r)"

# Make sure intel rapl kernel module is loaded
sudo modprobe intel_rapl_msr

# Finally, we'll ask the kernel how many joules `sleep 1` used
sudo perf stat -e power/energy-pkg/,power/energy-ram/ sleep 1
Example Results:
Performance counter stats for 'system wide':

             85.17 Joules power/energy-pkg/
             15.17 Joules power/energy-ram/

       1.001343899 seconds time elapsed
Using scaphandre to get per-process information
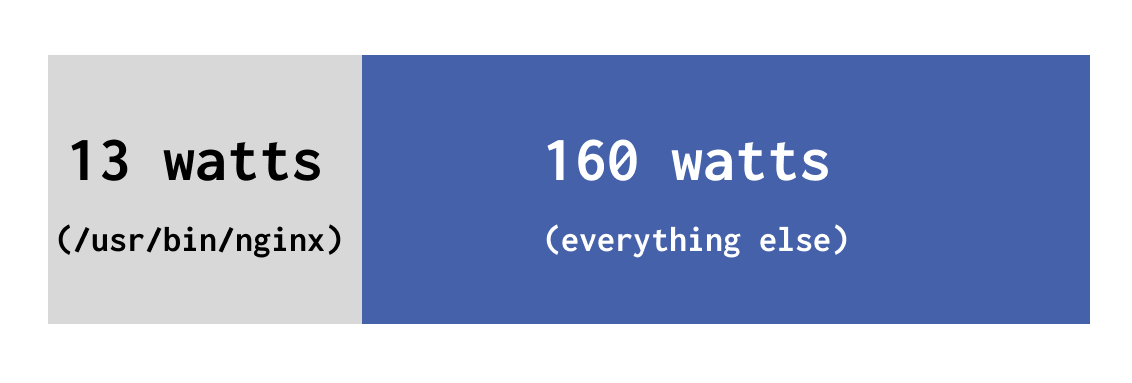
However, we can do better with the information available: Scaphandre is a powerful tool that combines this information from RAPL, as well as information about how much cpu time each process is using, to make good estimates of per-process power. For a comprehensive explanation of how/why it works, take a look at their docs.
Scaphandre is built in rust, so we can either install the rust deps, or pull their docker container.
# install dependencies for building scaphandre
sudo apt-get install \\\\
    pkg-config \\\\
    cargo \\\\
    rustup \\\\
    libssl-dev

cargo install scaphandre
Now, we can run scaphandre and see what it shows us:
sudo ~/.cargo/bin/scaphandre stdout --timeout 10 --step 1
...
------------------------------------------------------------

Host:	100.568017 W from
	package 	dram
Socket1	41.074833 W |	7.629241 W

Socket0	44.256115 W |	7.599235 W

Top 5 consumers:
Power		PID	Exe
0.6129861 W	130088	"/home/cc/.cargo/bin/scaphandre"
0.009577908 W	116790	"/usr/bin/containerd"
0 W	167	""
0 W	1139	""
0 W	117309	""
------------------------------------------------------------
Let's install a benchmarking tool, stress-ng, and run that while we monitor usage.
# install stress-ng
sudo apt install stress-ng

# run stress-ng for 60s, with parameters to:
# use a single thread to load the CPU
# pin the thread to only core ID 0
# and run in the background

stress-ng --taskset 0 --cpu 1 --timeout 60s &

# run scaphandre again
sudo ~/.cargo/bin/scaphandre  stdout --timeout 10 --step 1
And the results:
------------------------------------------------------------

Host:	105.828908 W from
	package 	dram
Socket1	41.515255 W |	7.549873 W

Socket0	49.148525 W |	7.582383 W

Top 5 consumers:
Power		PID	Exe
1.105572 W	130281	"/usr/bin/stress-ng"
0.720596 W	130284	"/home/cc/.cargo/bin/scaphandre"
0.009871177 W	116790	"/usr/bin/containerd"
0.009871177 W	94531	""
0 W	275	""
Collecting longer term data and plotting it
Both of these methods (perf and scaphandre) have just been printing human readable text. However, we can easily get machine readable output.
Scaphandre offers a bunch of helpful methods, like saving results to a json file. Or, for something fully integrated, you can run it as a prometheus exporter.
To try this out, we'll grab scaphandre's git repo, and use their example docker-compose file to run scaphandre to export the power data, prometheus to query it, and grafana to plot it.
-
If your image doesn't have it, we'll need to install docker and docker-compose
# Add Docker's official GPG key: sudo apt-get update sudo apt-get install ca-certificates curl sudo install -m 0755 -d /etc/apt/keyrings sudo curl -fsSL <https: download.docker.com="" gpg="" linux="" ubuntu=""> -o /etc/apt/keyrings/docker.asc sudo chmod a+r /etc/apt/keyrings/docker.asc # Add the repository to Apt sources: echo \\\\ "deb [arch=$(dpkg --print-architecture) signed-by=/etc/apt/keyrings/docker.asc] <https: download.docker.com="" linux="" ubuntu=""> \\\\ $(. /etc/os-release && echo "$VERSION_CODENAME") stable" | \\\\ sudo tee /etc/apt/sources.list.d/docker.list > /dev/null sudo apt-get update sudo apt-get install docker-ce docker-ce-cli containerd.io docker-buildx-plugin docker-compose-plugin </https:></https:> -
grab the scaphandre git repo
git clone <https: github.com="" hubblo-org="" scaphandre.git=""> </https:> -
for security, change prometheus and scaphandre to listen on localhost, and change the grafana password to
mysuperdemopasswordcd scaphandre/docker-compose/ sed -i 's/8080:8080/127.0.0.1:8080:8080/' docker-compose.yaml sed -i 's/9090:9090/127.0.0.1:9090:9090/' docker-compose.yaml sed -i 's/secret/mysuperdemopassword/' docker-compose.yaml -
check your public IP, and access grafana in your browser on port 3000, with credentials
admin/mysuperdemopassword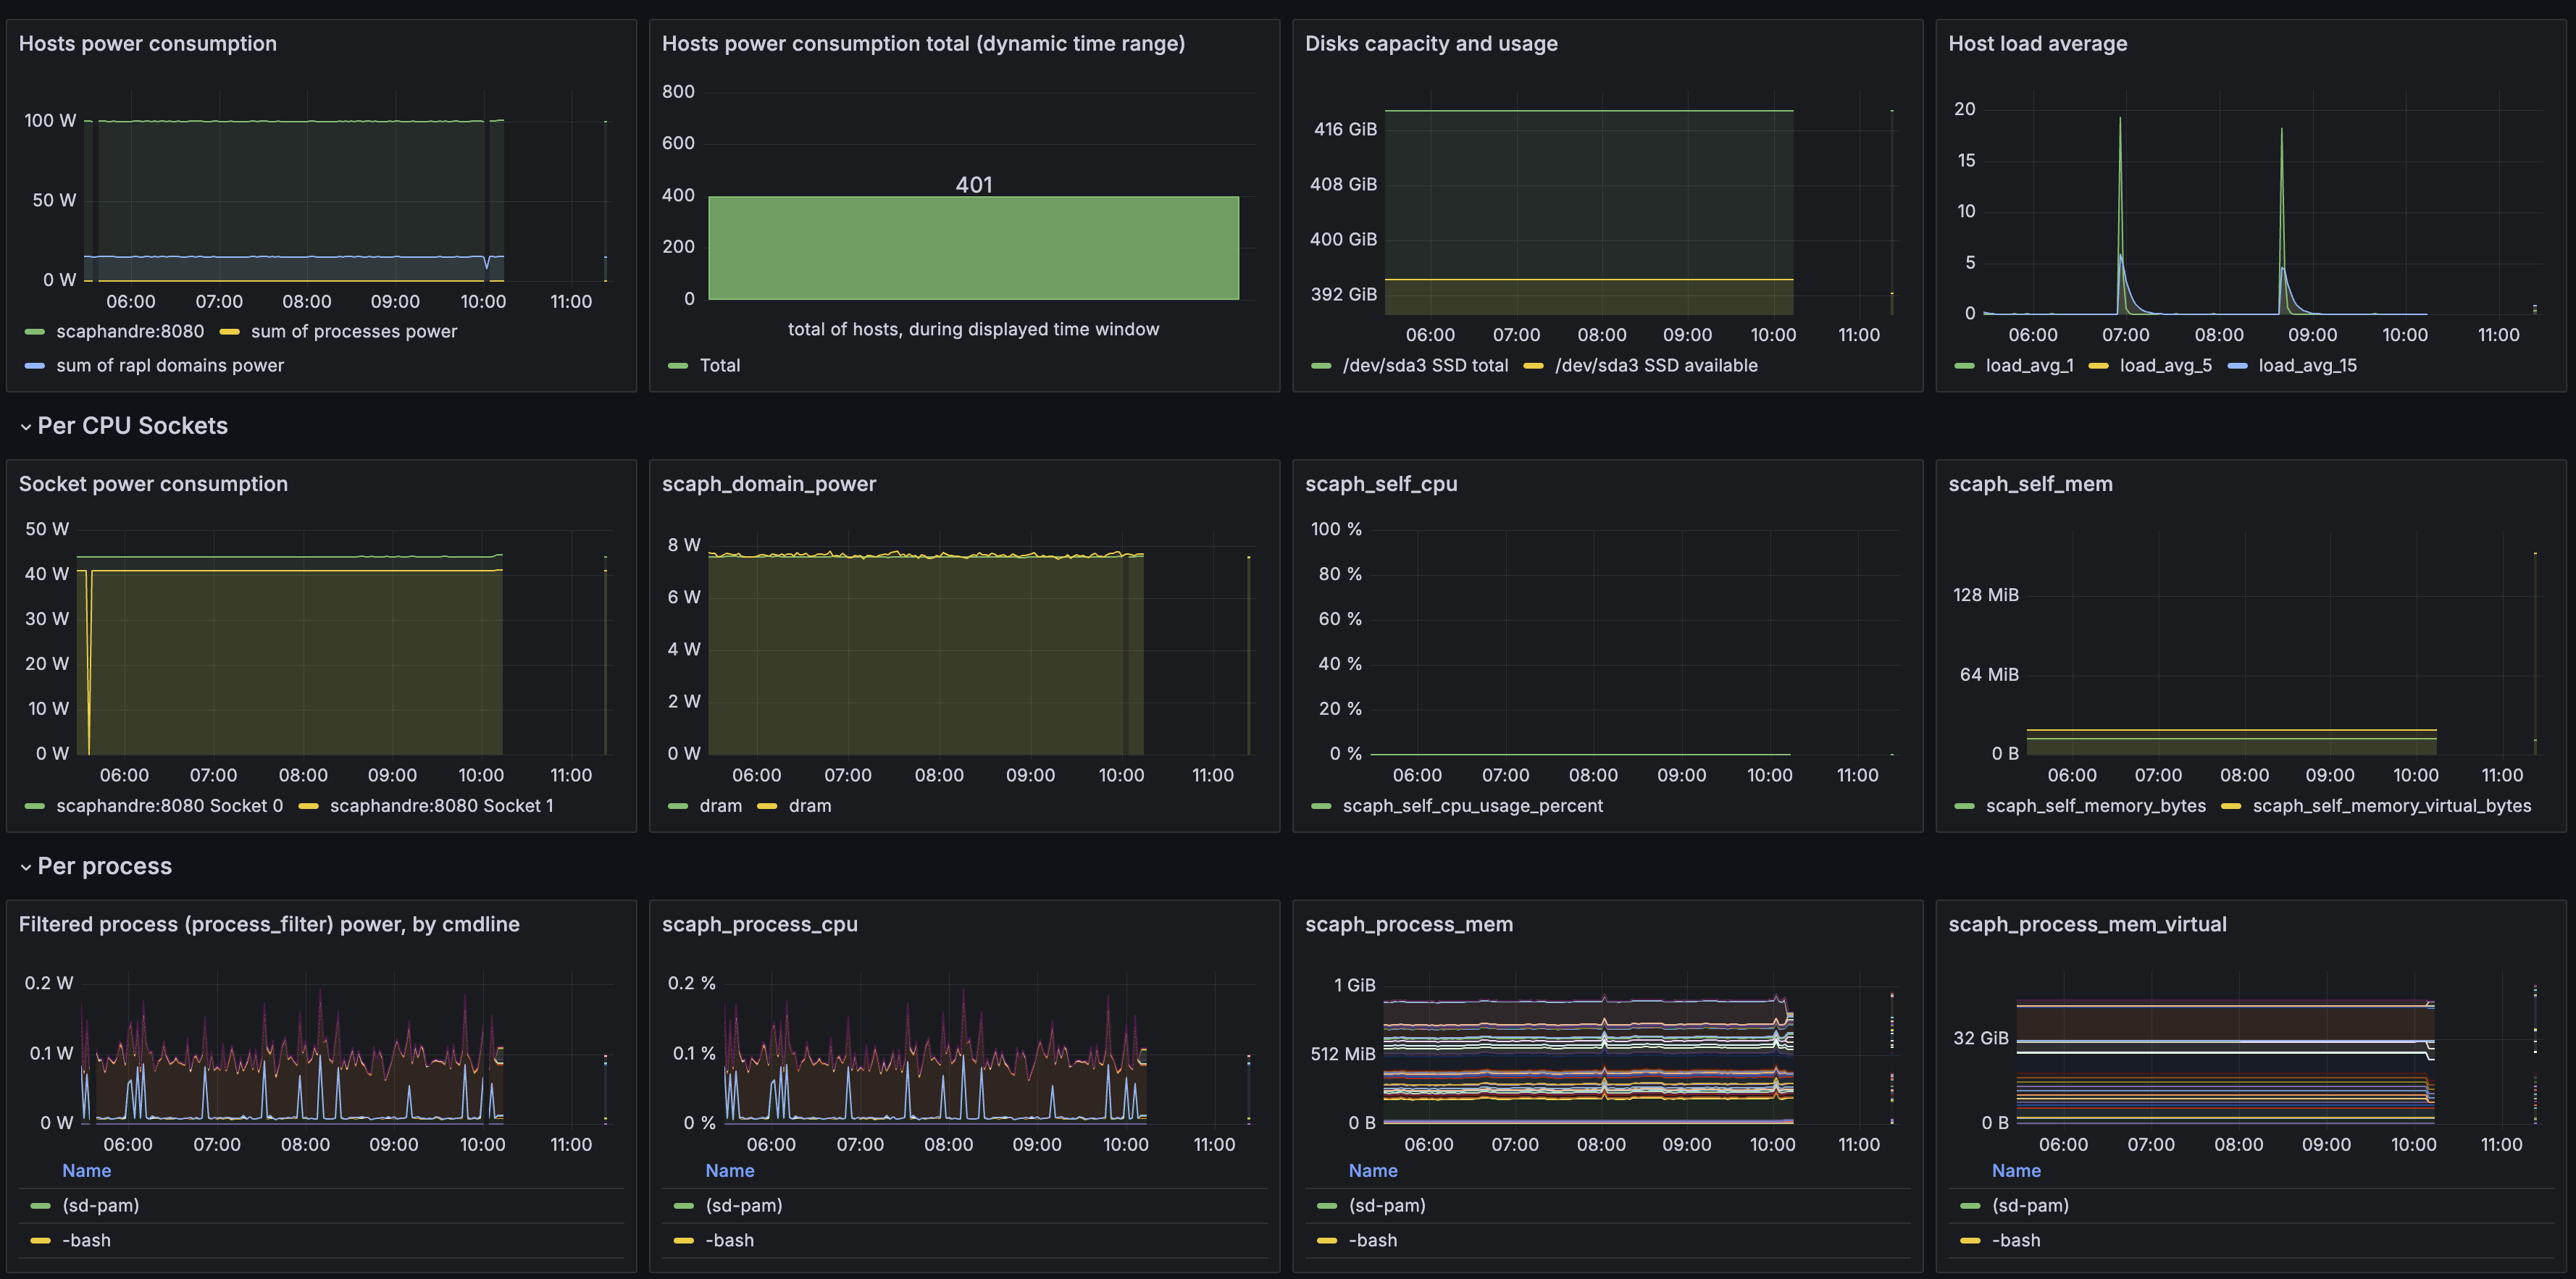
-
Finally, lets kick off a big stress test on all cpu cores:
stress-ng --cpu $(nproc) --timeout 60stress-ng: info: [133743] setting to a 60 second run per stressor stress-ng: info: [133743] dispatching hogs: 96 cpu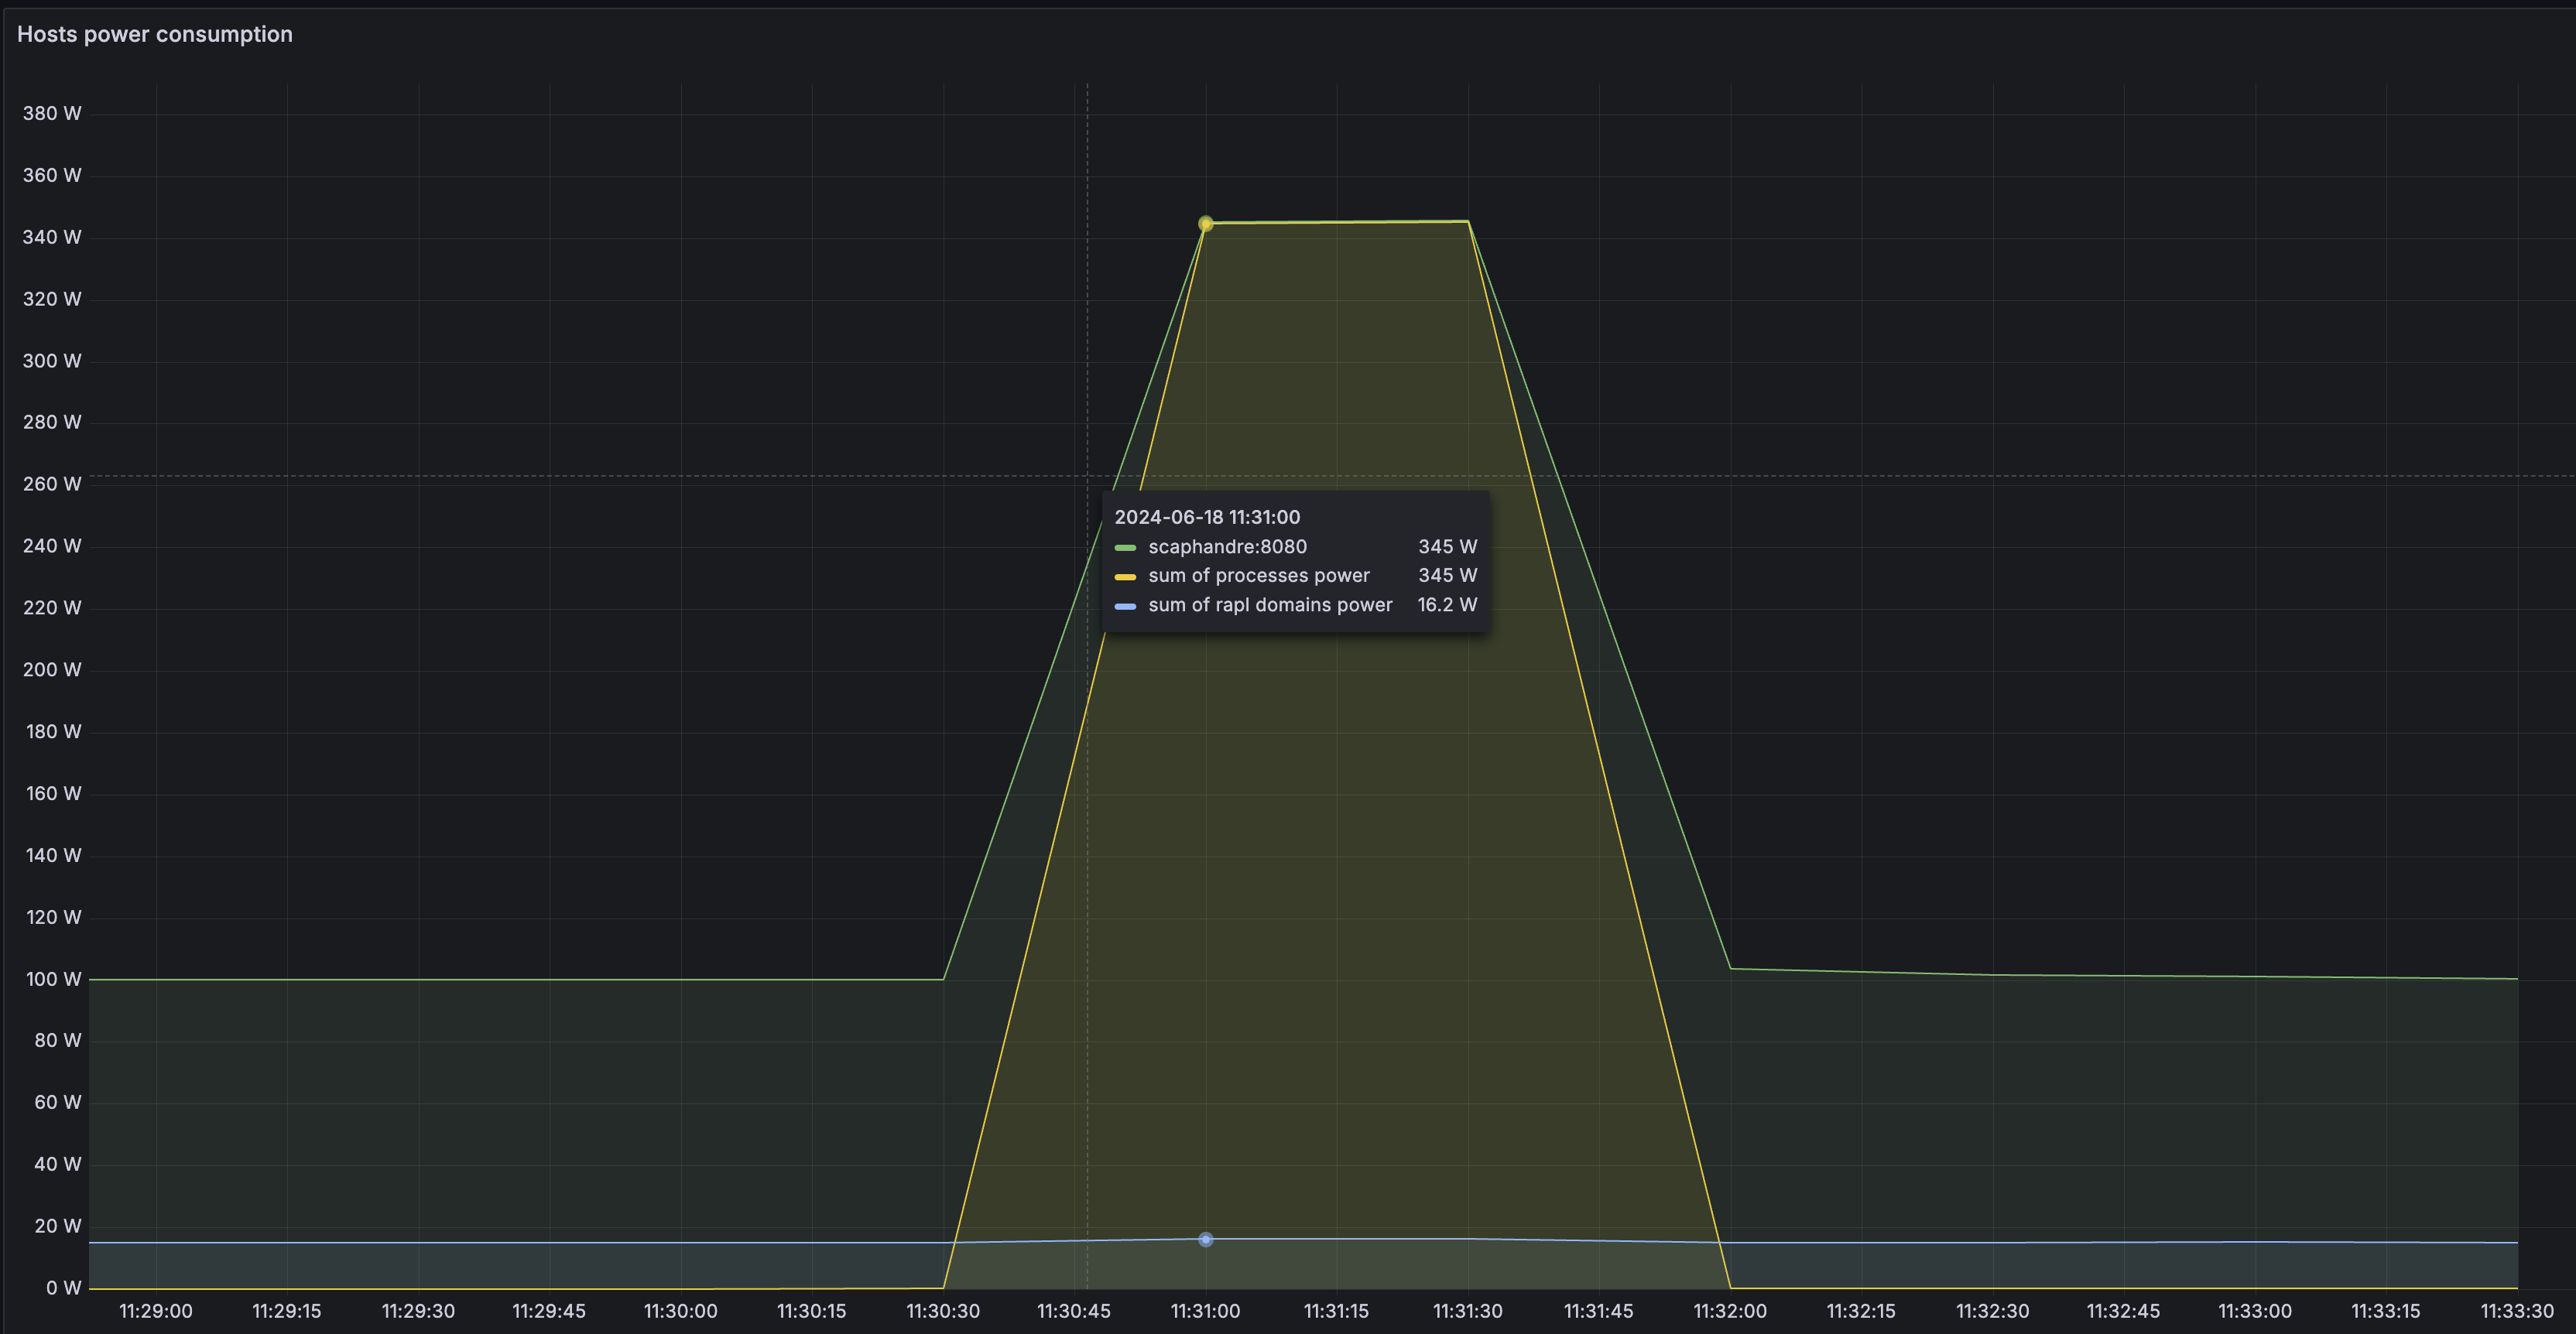
Using this approach, you can use prometheus on one node to monitor power consumption of multiple others, as well as related metrics like cpu usage.
Combining data from DCMI and RAPL
For best results, you'll want both system-level power from DCMI, and cpu/memory/process level data from RAPL. To do this, with prometheus, you can run a combination of the scaphandre prometheus exporter, and the prometheus ipmi exporter which calls the above ipmi-dcmi commands.
For a simple script, check out the Energizta project.
wget <https: boavizta="" energizta="" energizta.sh="" main="" raw.githubusercontent.com="">
chmod +x energizta.sh
sudo ./energizta.sh --interval 1 --duration 1 --once --energy-only | jq '.'
{
  "interval_us": 1066379,
  "duration_us": 1066379,
  "nb_states": 1,
  "powers": {
    "dcmi_cur_watt": 230,
    "rapl_dram_0_watt": 8,
    "rapl_dram_1_watt": 8,
    "rapl_package_0_watt": 44,
    "rapl_package_1_watt": 41,
    "rapl_total_watt": 101
  },
  "energizta_version": "0.5"
}

</https:>
Further Reading
For a much deeper dive into this, I can recommend the following readings:
Maximizing Performance in Distributed Systems with a Power Budget
- Oct. 15, 2019 by
- Huazhe Zhang
One challenge for power budgeting systems is how to power cap dependent applications for high performance. Existing approaches, however, have major limitations. Our work proposes a hierarchical, distributed, dynamic power management system for dependent applications.
Power to People: Monitoring Power Consumption of Low Power Nodes
- June 22, 2018 by
- Joe Stubbs
Did you ever wonder how much power was consumed by executing a program? The Chameleon team recently implemented a feature that automatically collects power usage data on all low power nodes in the system. Instantaneous power usage data (in watts) are collected through the IPMI interface on the chassis controller for the nodes. This “out-of-band” approach does not consume additional power on the node itself and runs even when the node is powered off. Low power nodes for which power usage data are now being collected include all Intel Atoms, low power Xeons, and ARM64s. In this blog post we look at this new feature and use it to calculate the power consumption associated with multiplying two large Python numpy arrays.
No comments