 Security Onion Network Monitoring: Documentation
Appliance Details
Security Onion Tutorial
Overview
This documentation is a tutorial on using the Security Onion complex appliance on Chameleon.
The appliance creates:
- A Ryu OpenFlow controller compatible with the Chameleon Corsa DP2000 switches. The controller is designed to mirror all traffic to the Security Onion node for processing.
- An isolated OpenFlow tenant network controlled by the custom Ryu controller
- A user specified number of additional nodes connected to the new OpenFlow network.
This appliance can be used as a base for designing your own security experiments using Bro, Snort, or other Security Onion packages..
After completing this tutorial you should be able to:
- Run complex appliances on Chameleon.
- Understand how to use the basic Security Onion functionality to monitor network traffic.
Prerequisites
This tutorial assumes you have a Chameleon account.
Additional information:
- Getting started tutorial: https://chameleoncloud.readthedocs.io/en/latest/getting-started/index.html
- Using Heat templates: https://chameleoncloud.readthedocs.io/en/latest/technical/complex.html
Security Onion
Security Onion is an open source distribution including many intrusion detection and security monitoring applications in a single package. It is designed to be simple to configure and deploys in minutes. This tutorial shows how to deploy a private network on Chameleon and monitor it using Security Onion. The purpose of to this appliance is to create a network that mirrors traffic to the monitoring service which, in turn, presents monitoring information to the user. The basic topology and resources can be see in the figure below.
The topology includes:
- A private Software Defined Network (SDN) with its own OpenFlow controller that mirrors all traffic to be monitored by Security Onion.
- A Security Onion node that consumes all mirrored traffic and presents it via a web interface.
- A number of nodes connected to the network. These nodes can be used to generate traffic that is monitored by Security Onion.

Tutorial: Starting the Nodes
- Log into Chameleon: https://chi.tacc.chameleoncloud.org/dashboard/project/
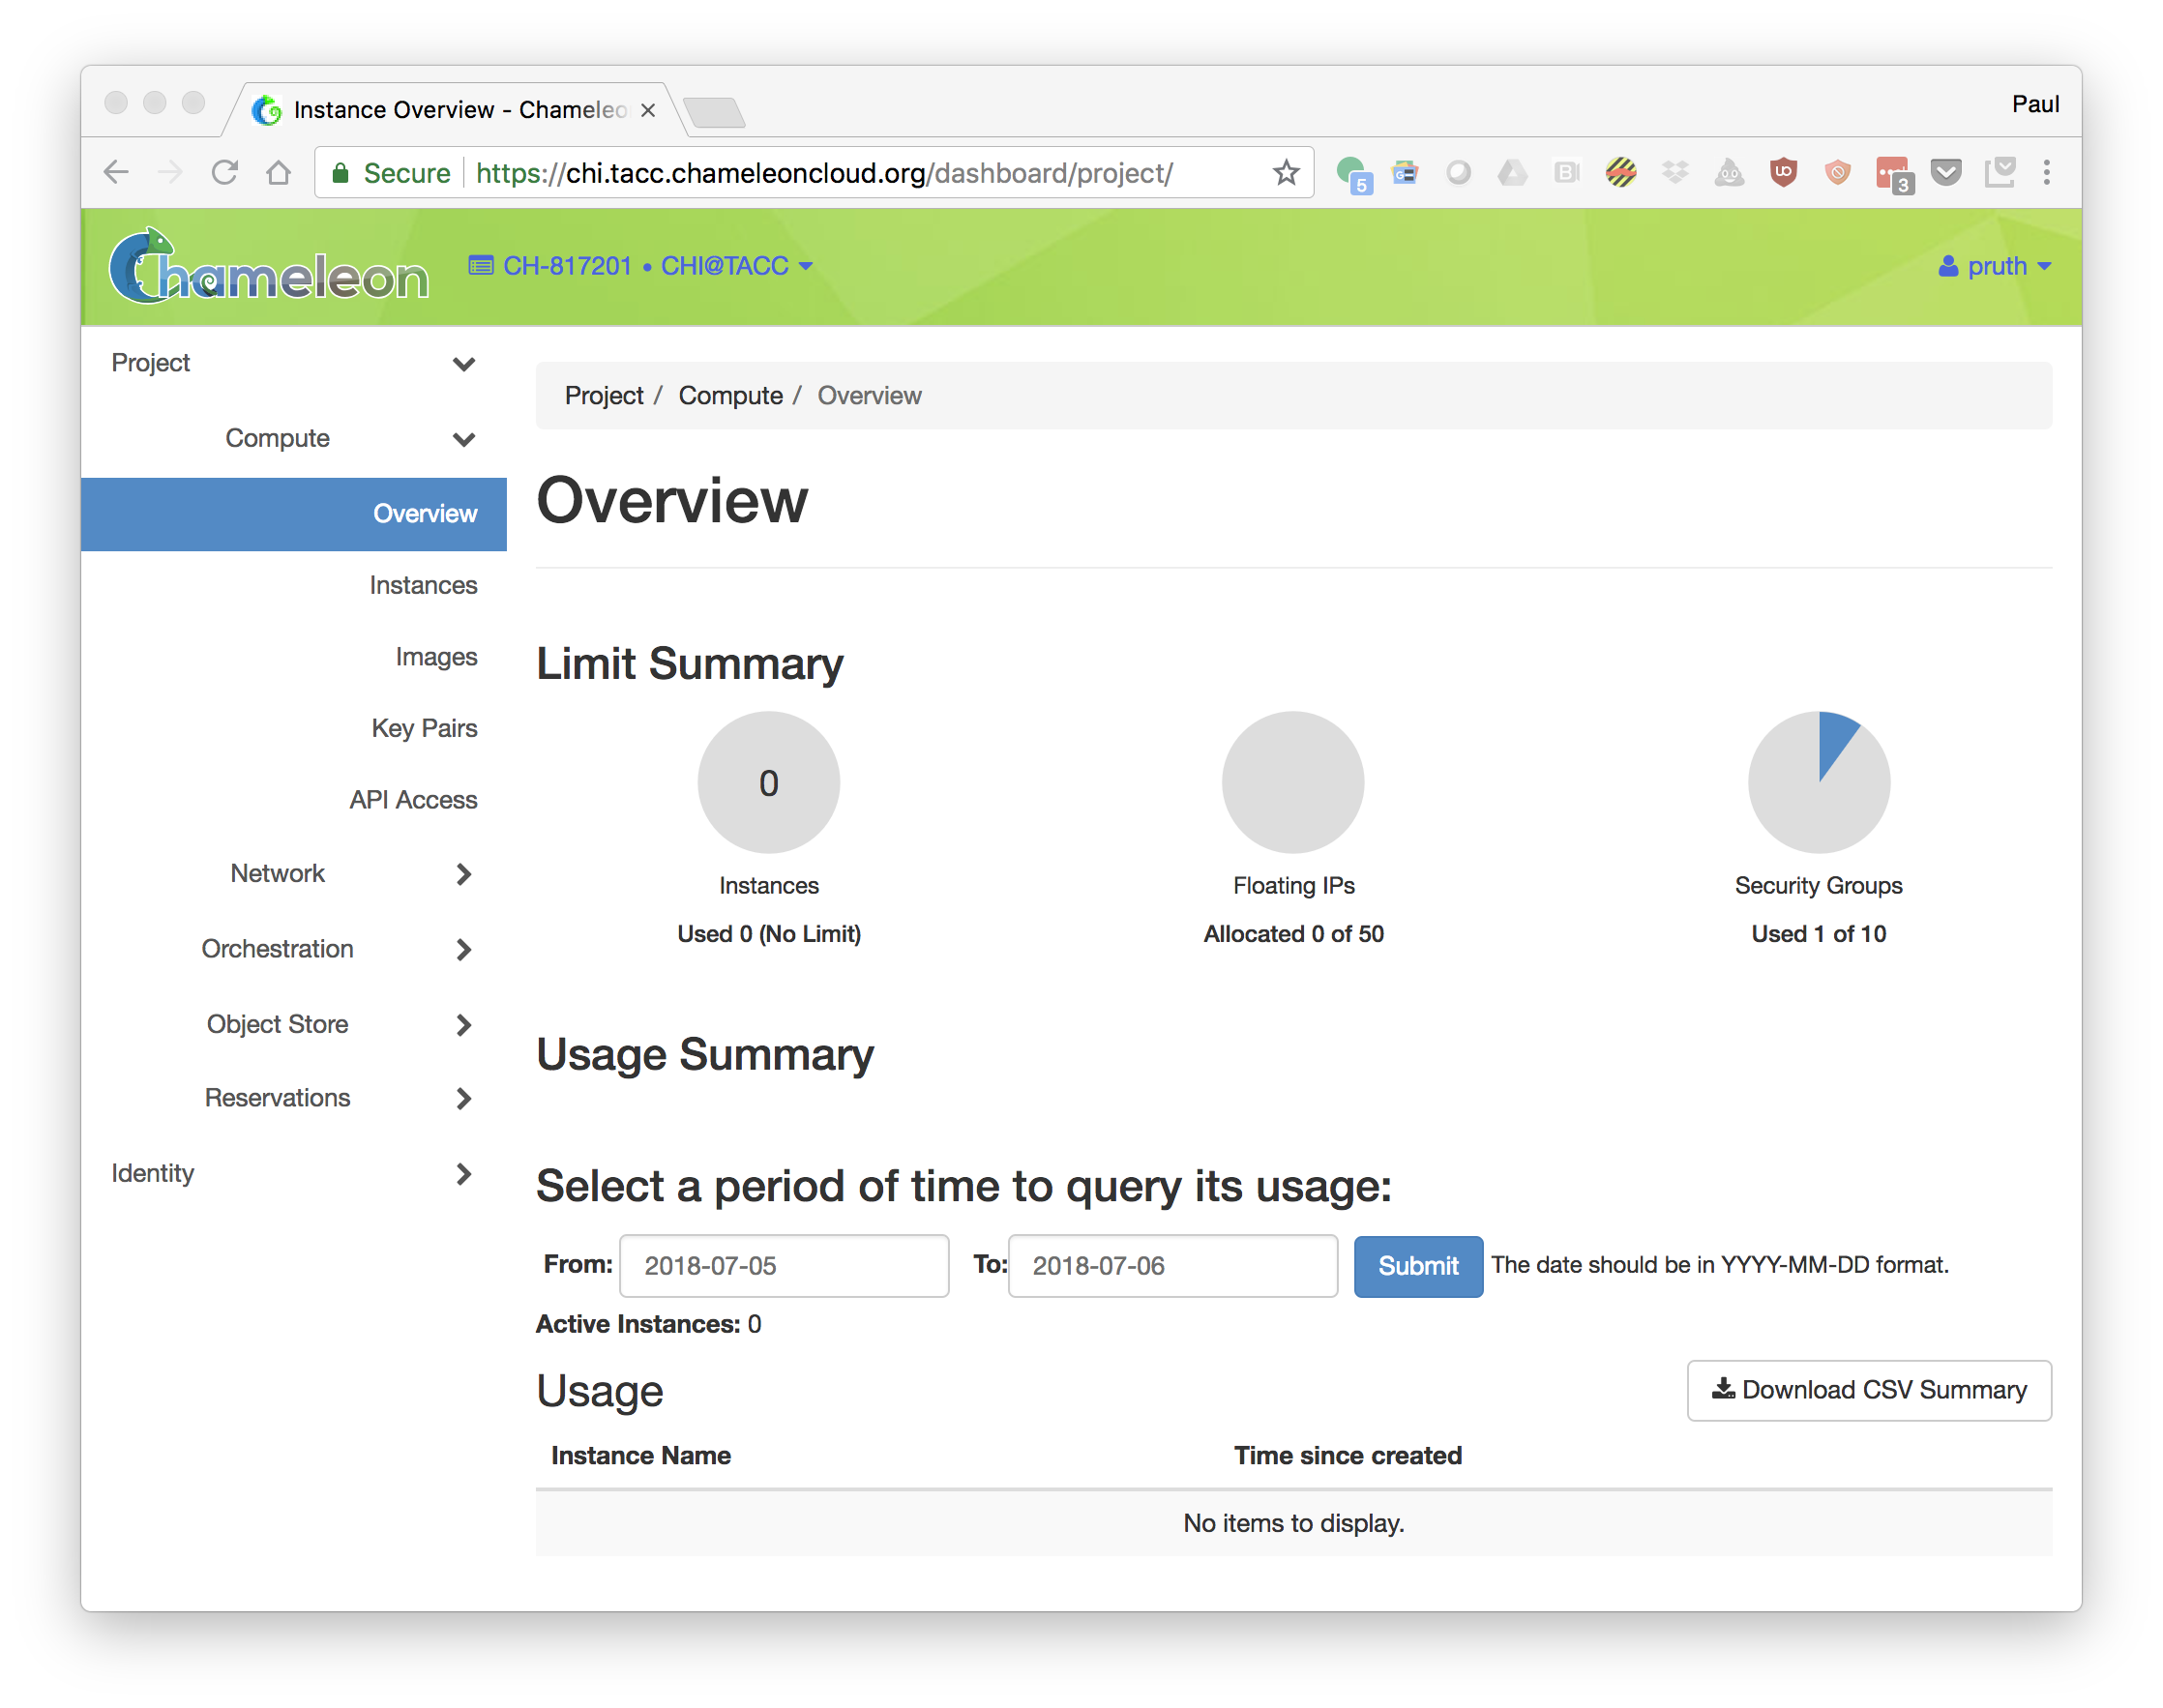
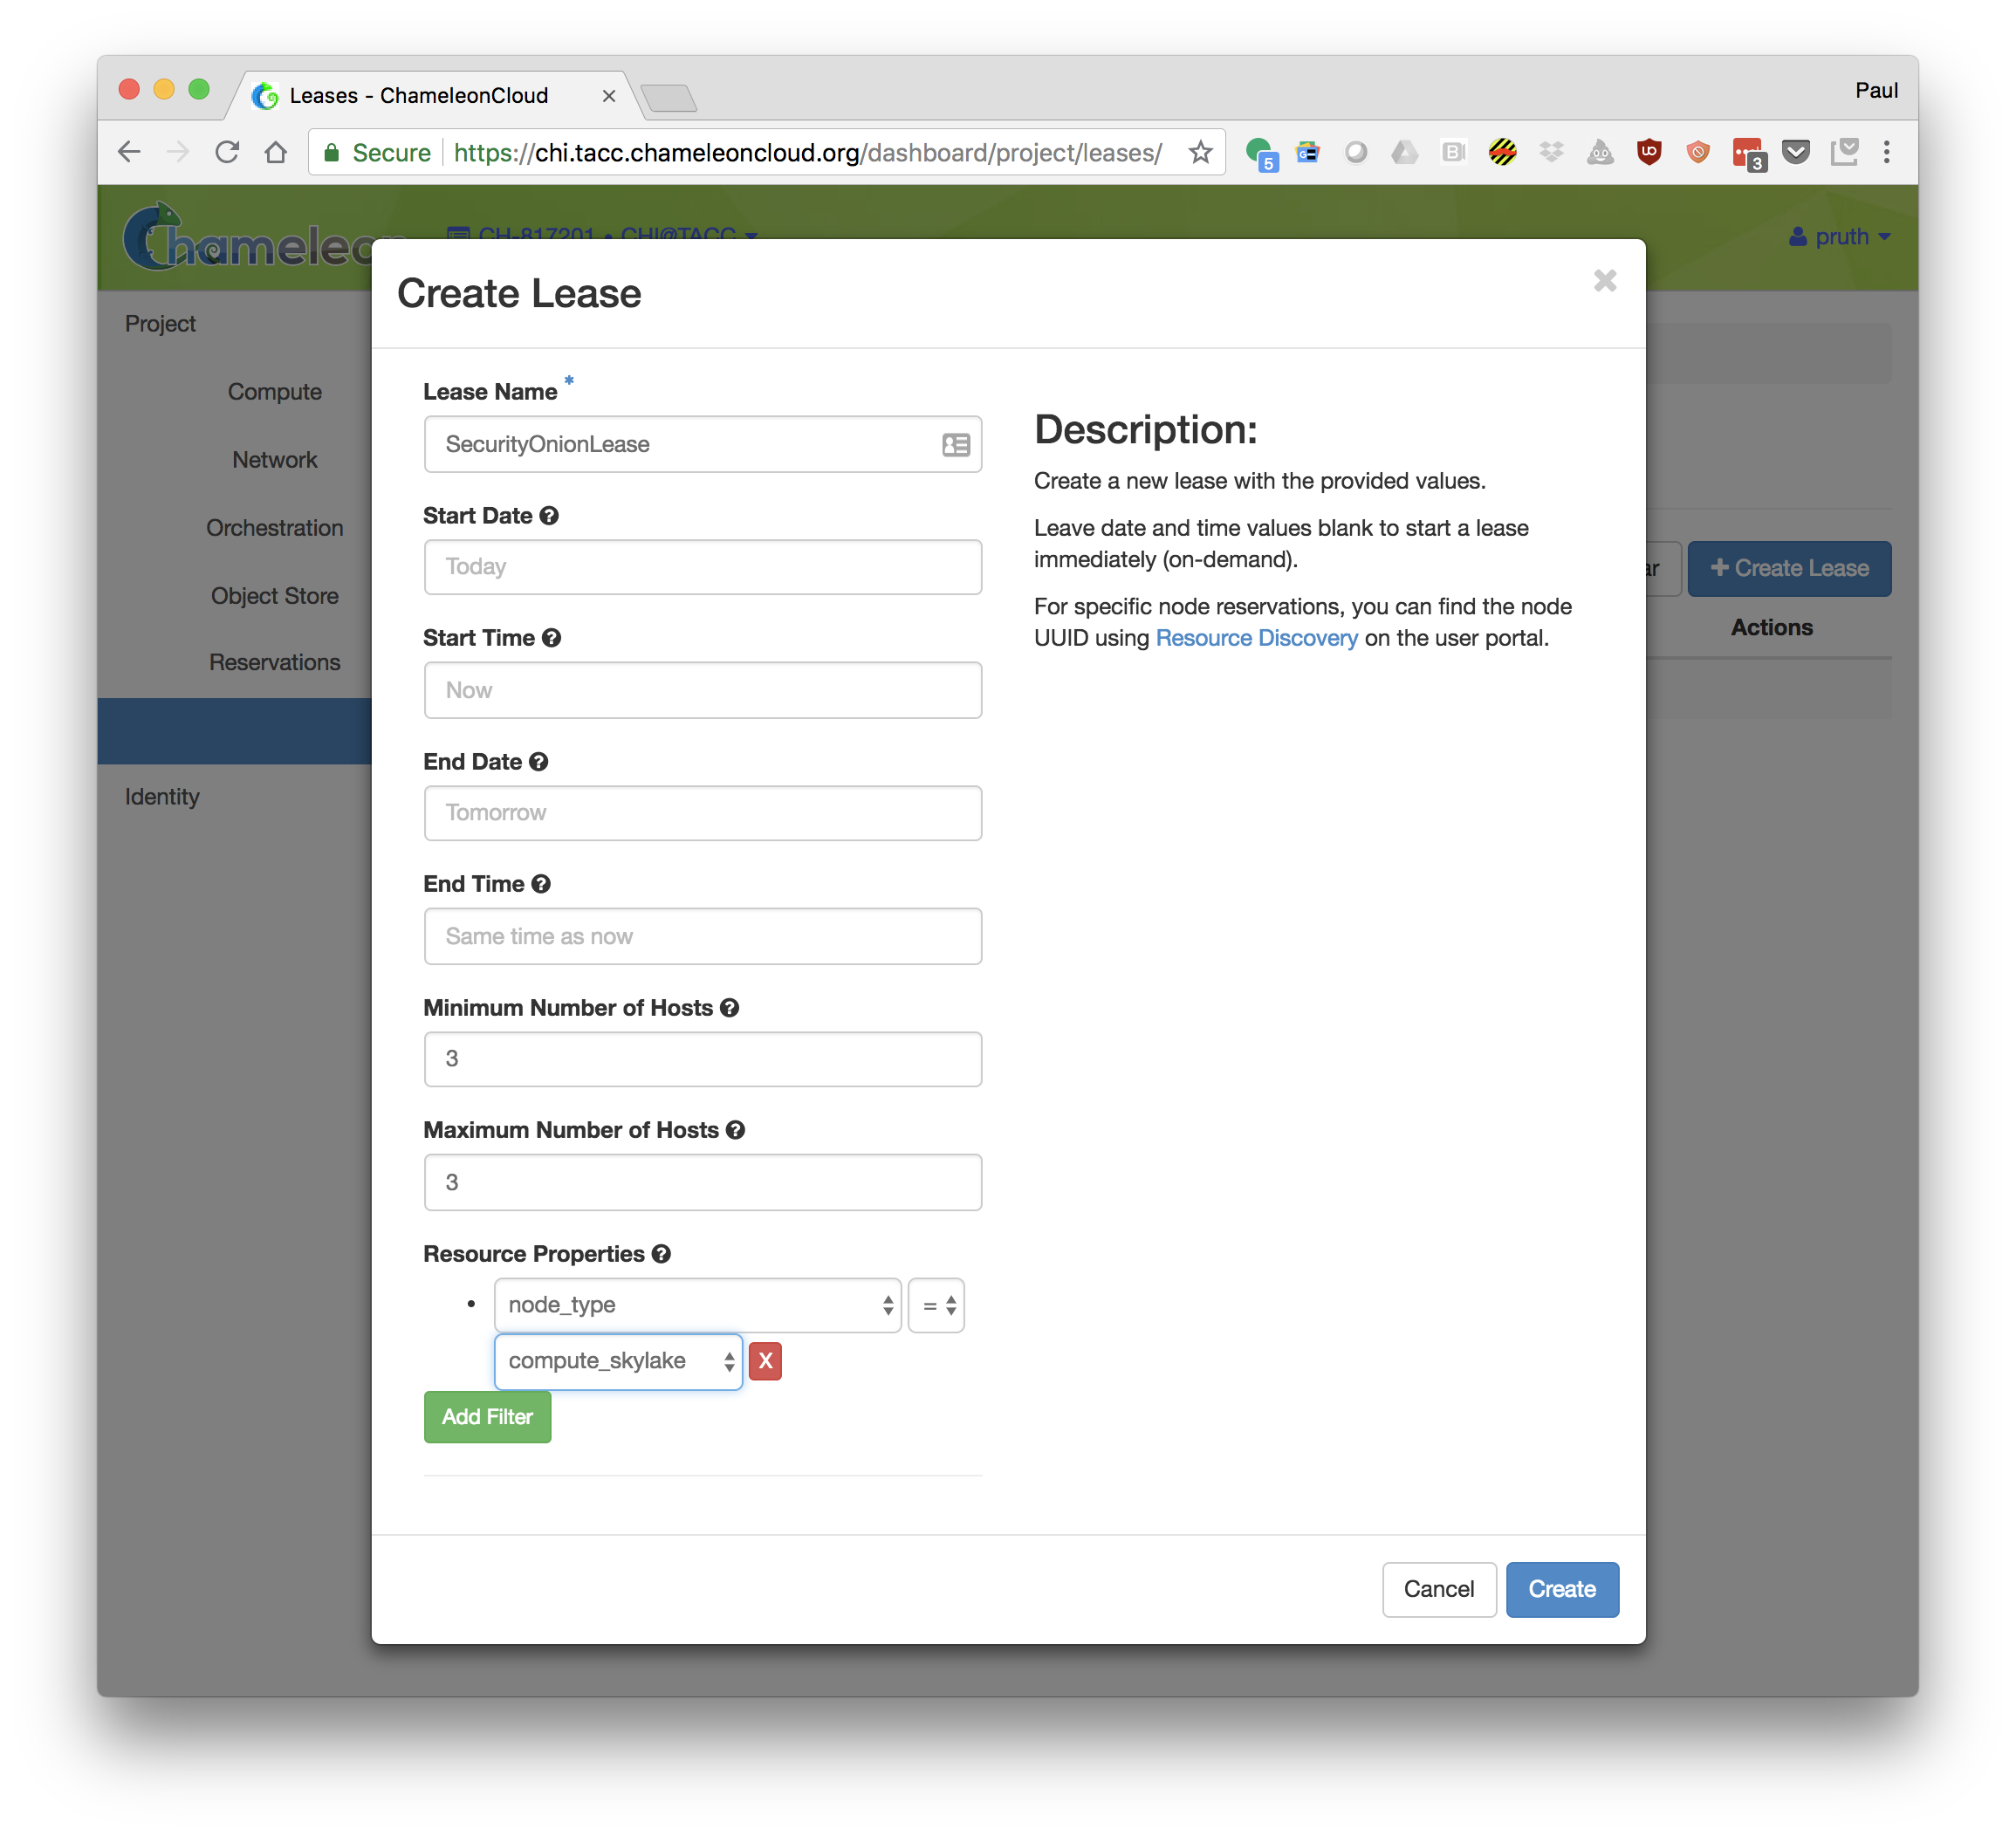
- Create a reservation for at least 3 Skylake node. Note that if you are participating in an organized tutorial, your instructor may have already made a reservation for the group.
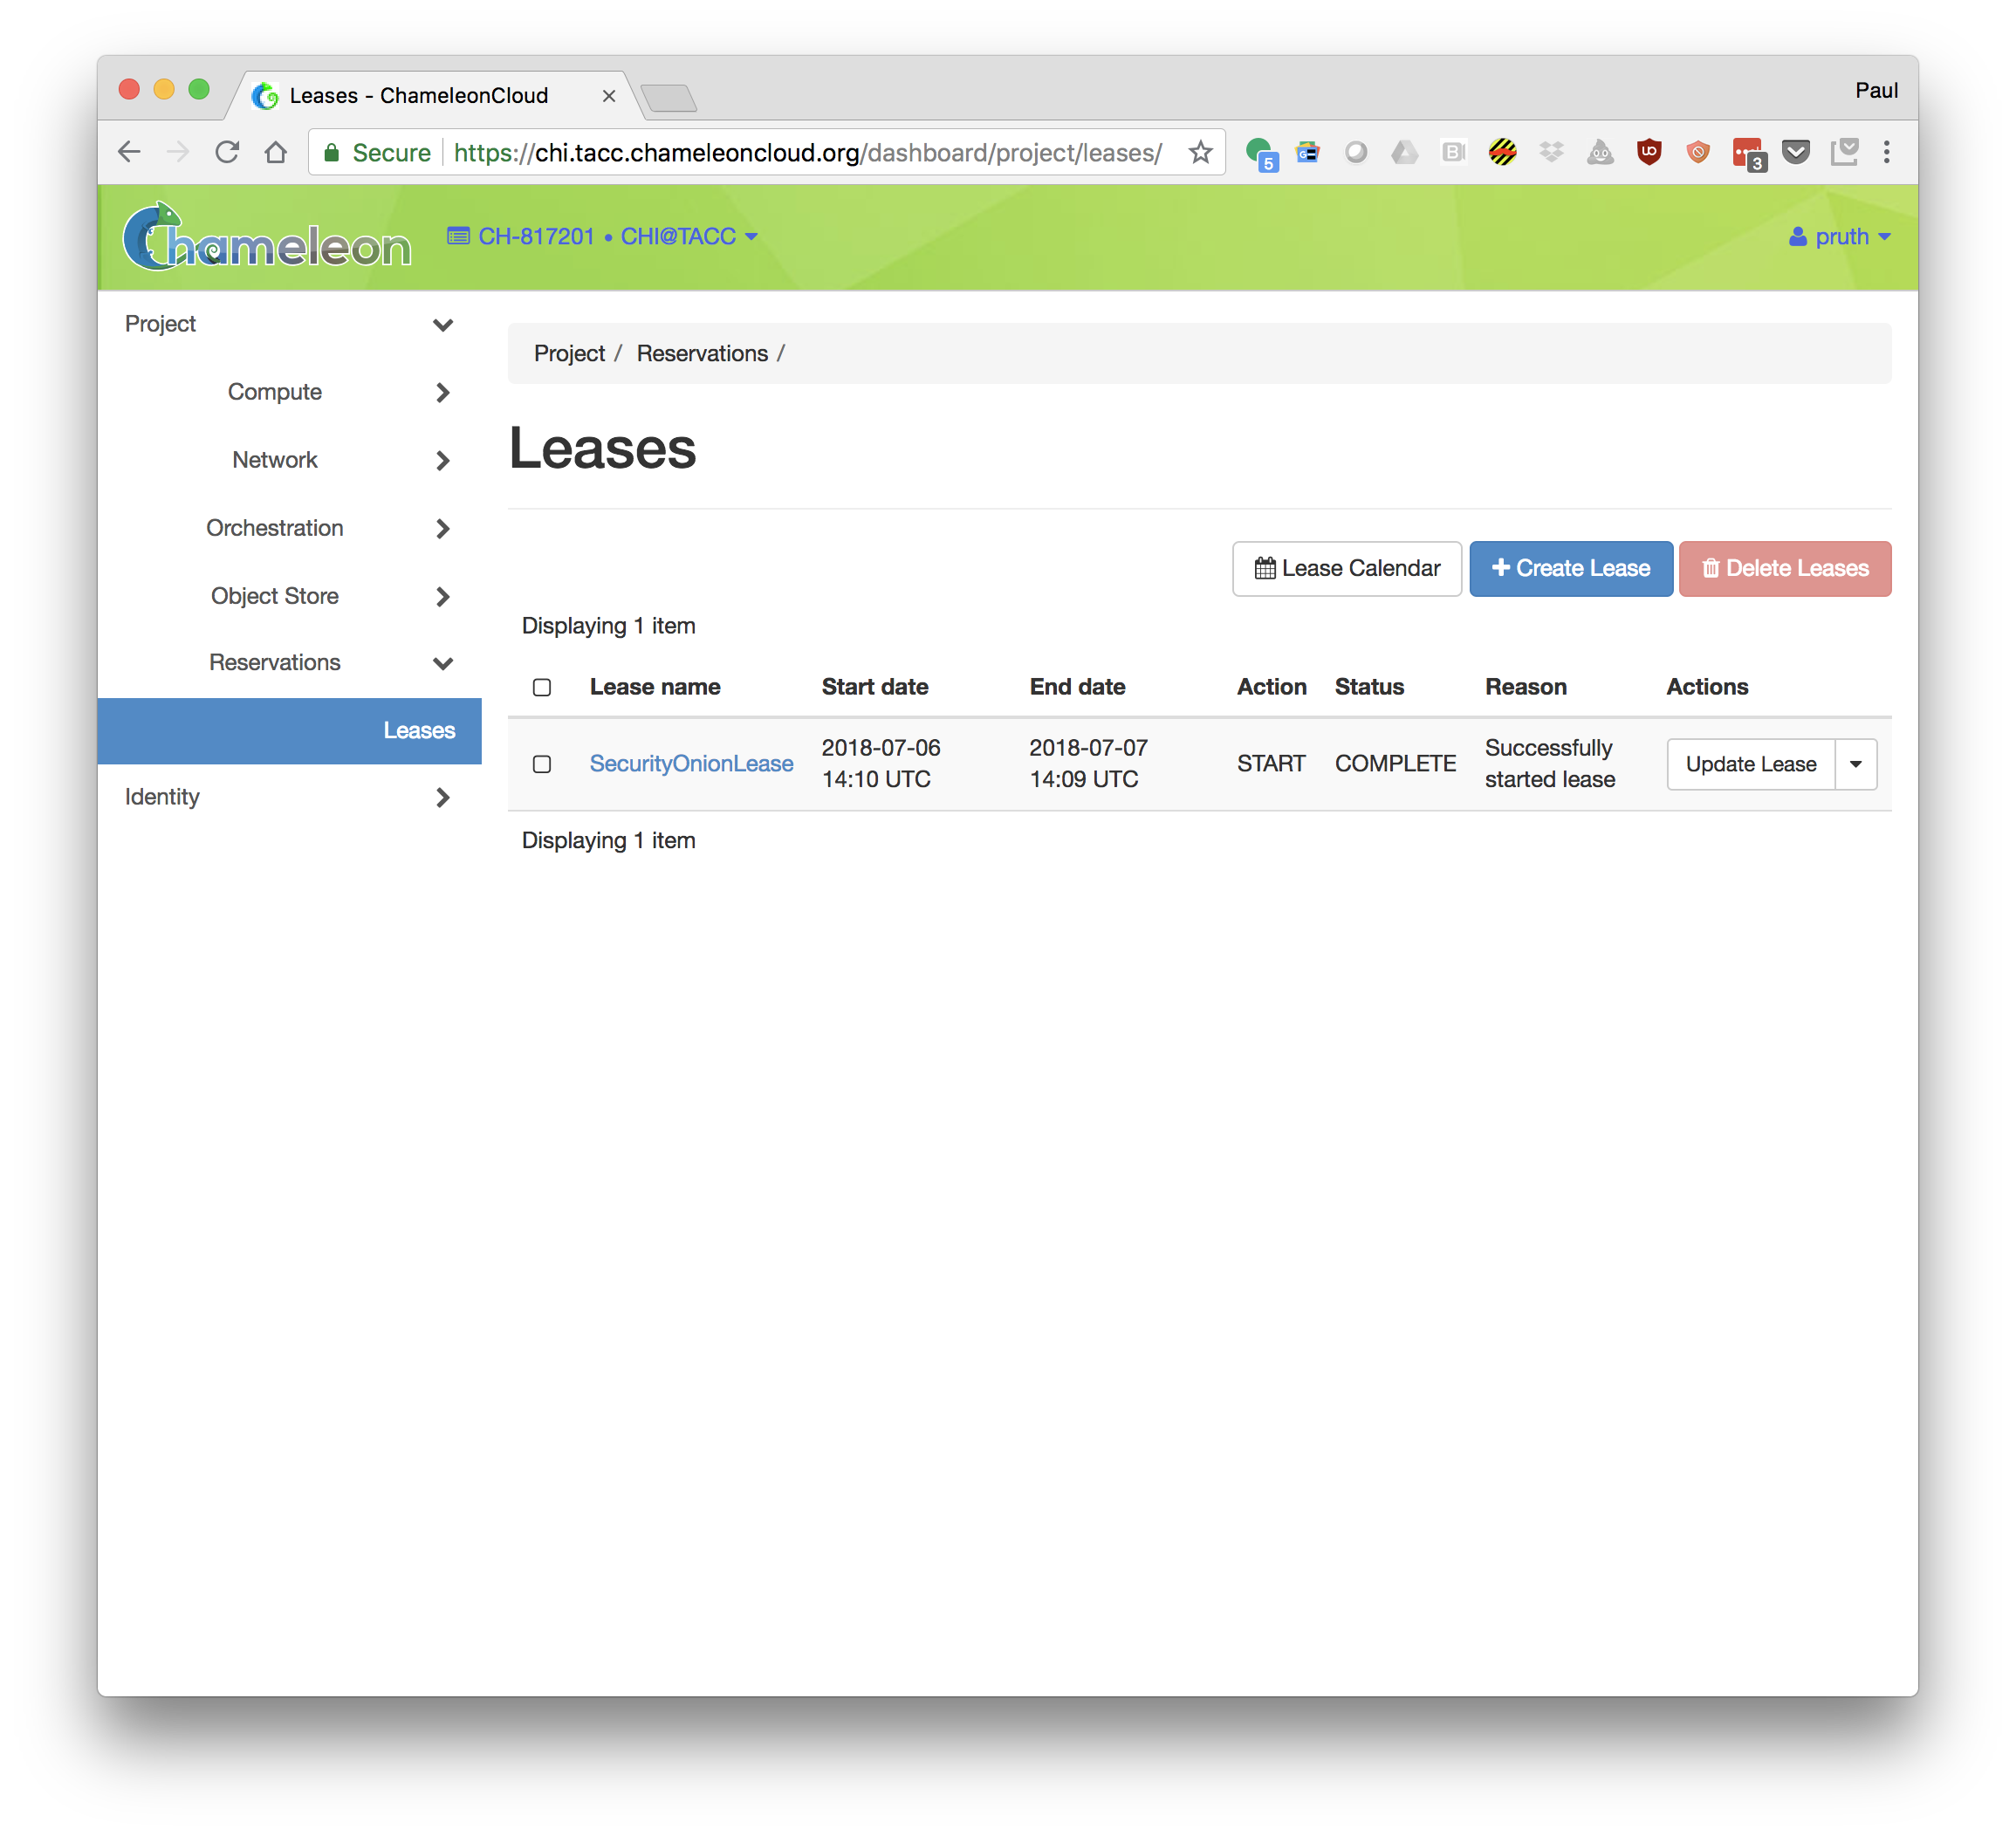
- Goto "Orchestration->Stacks"
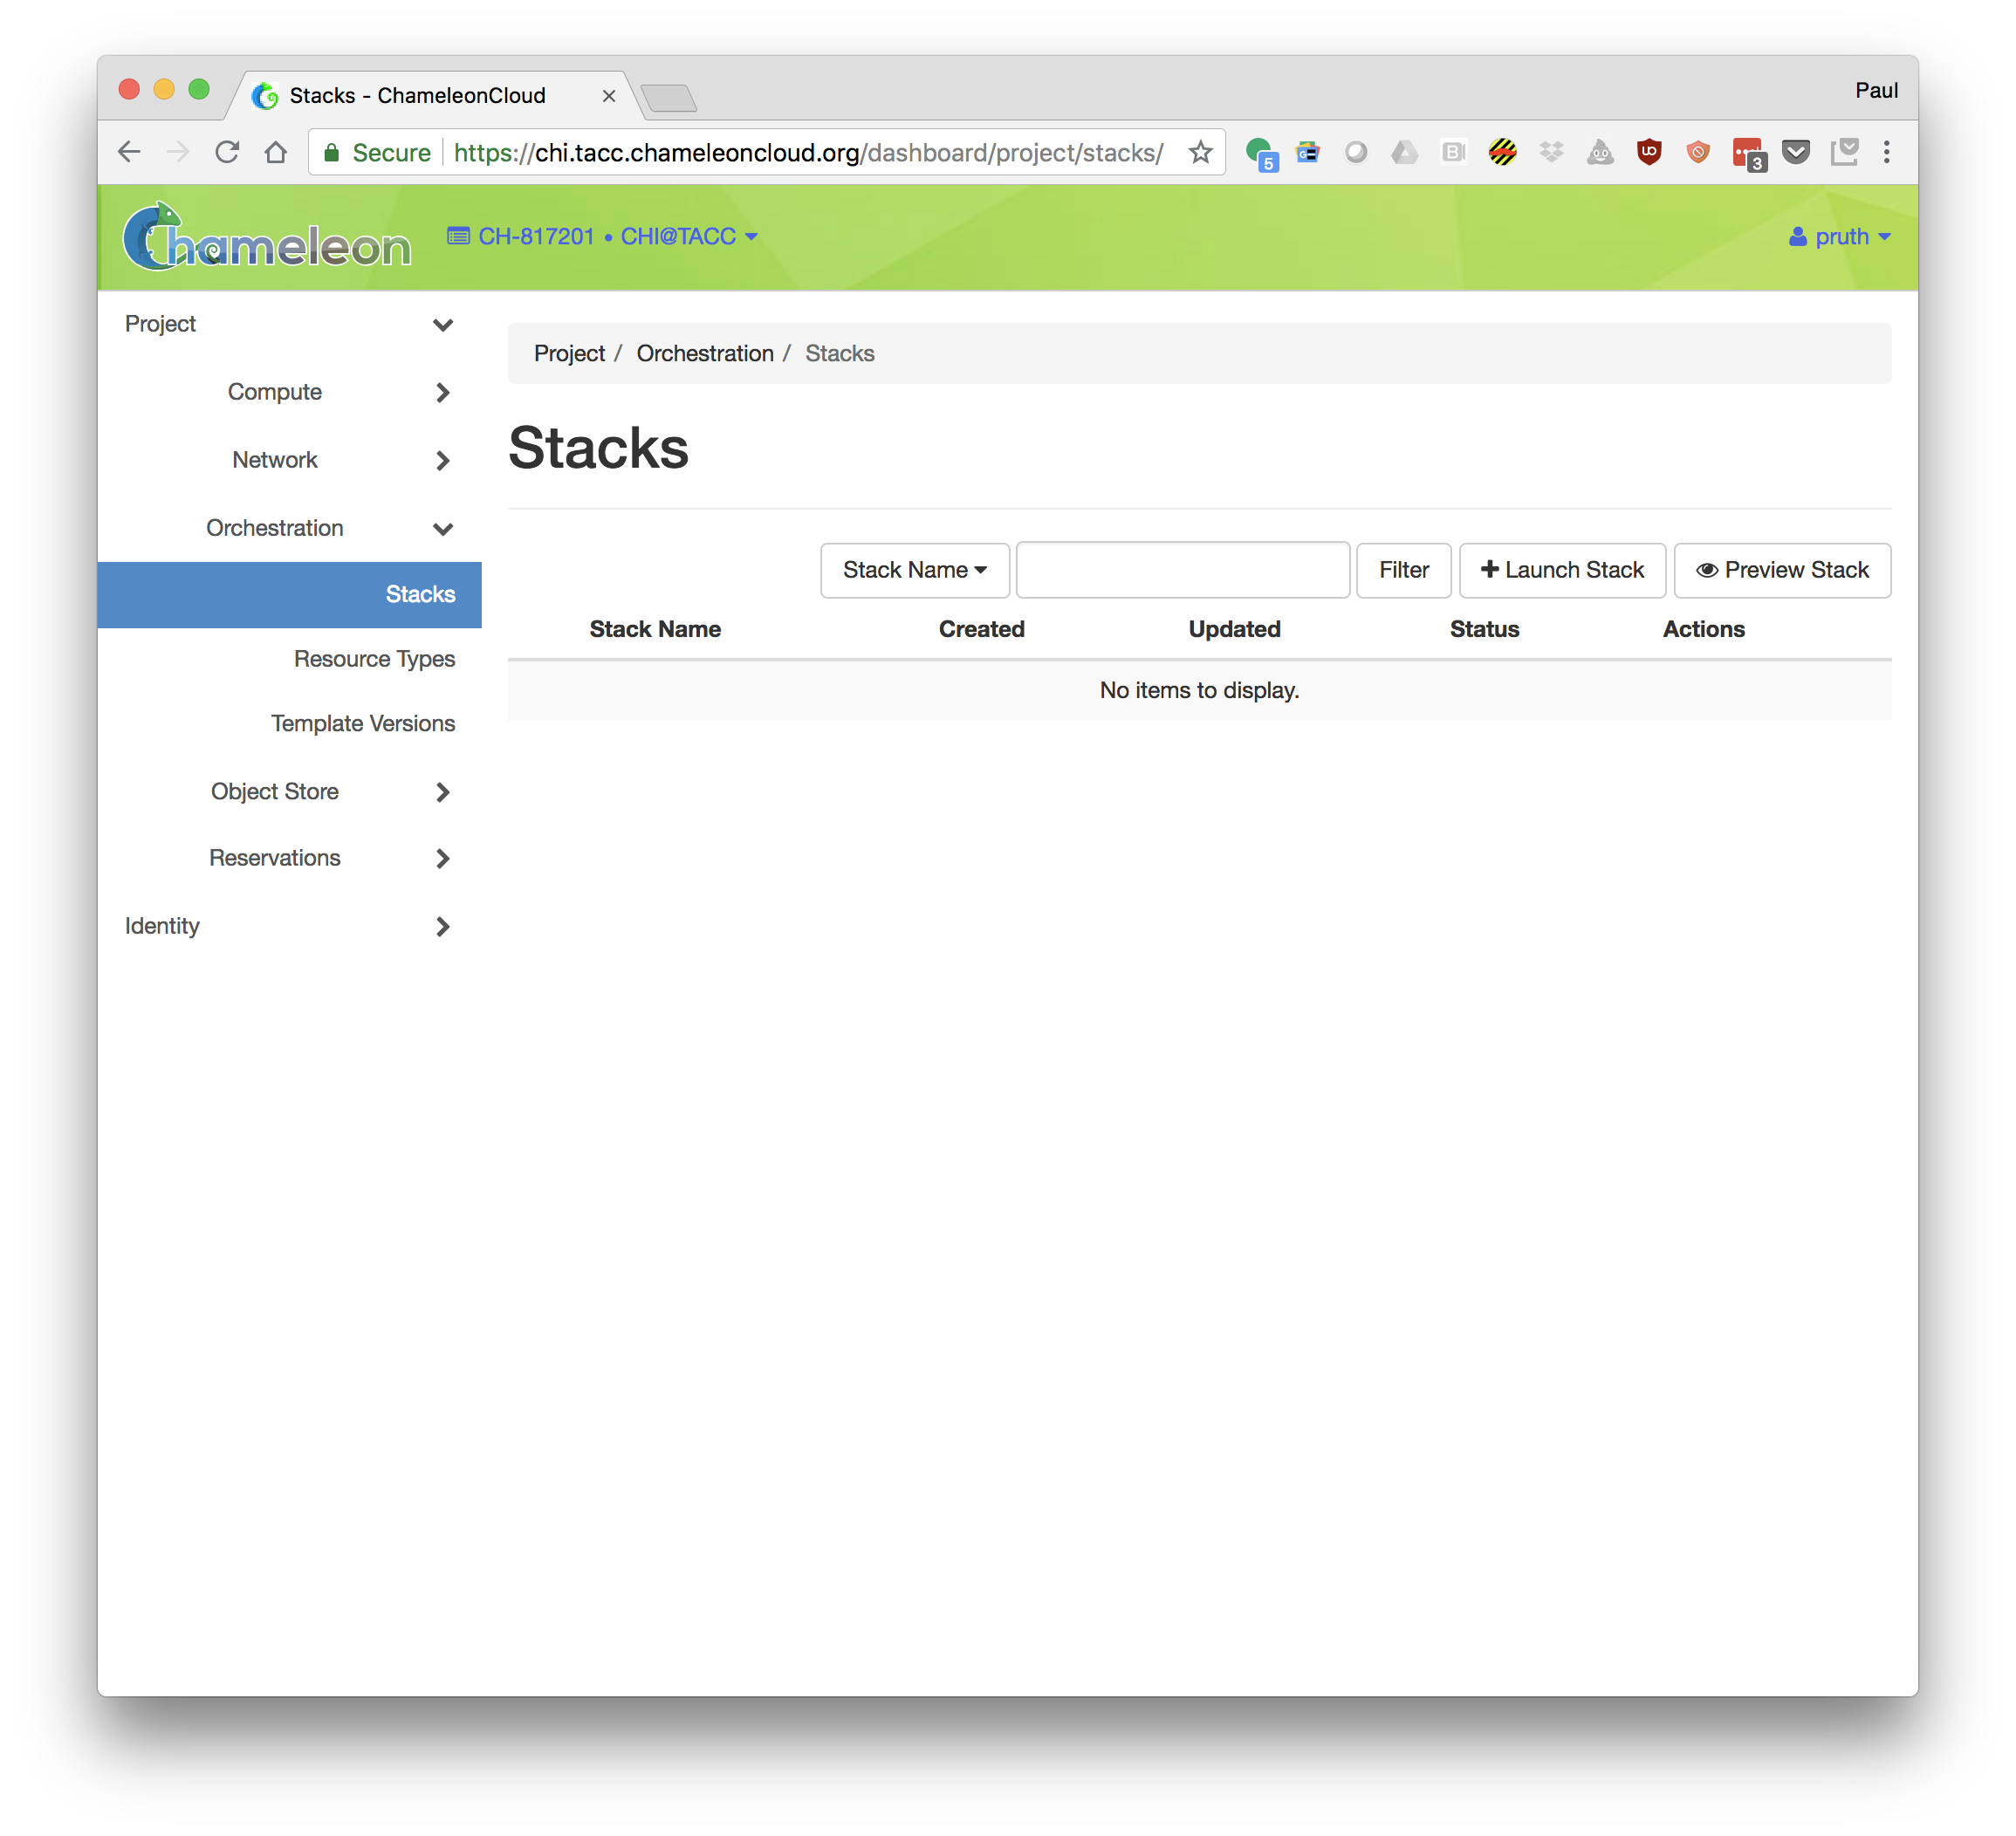
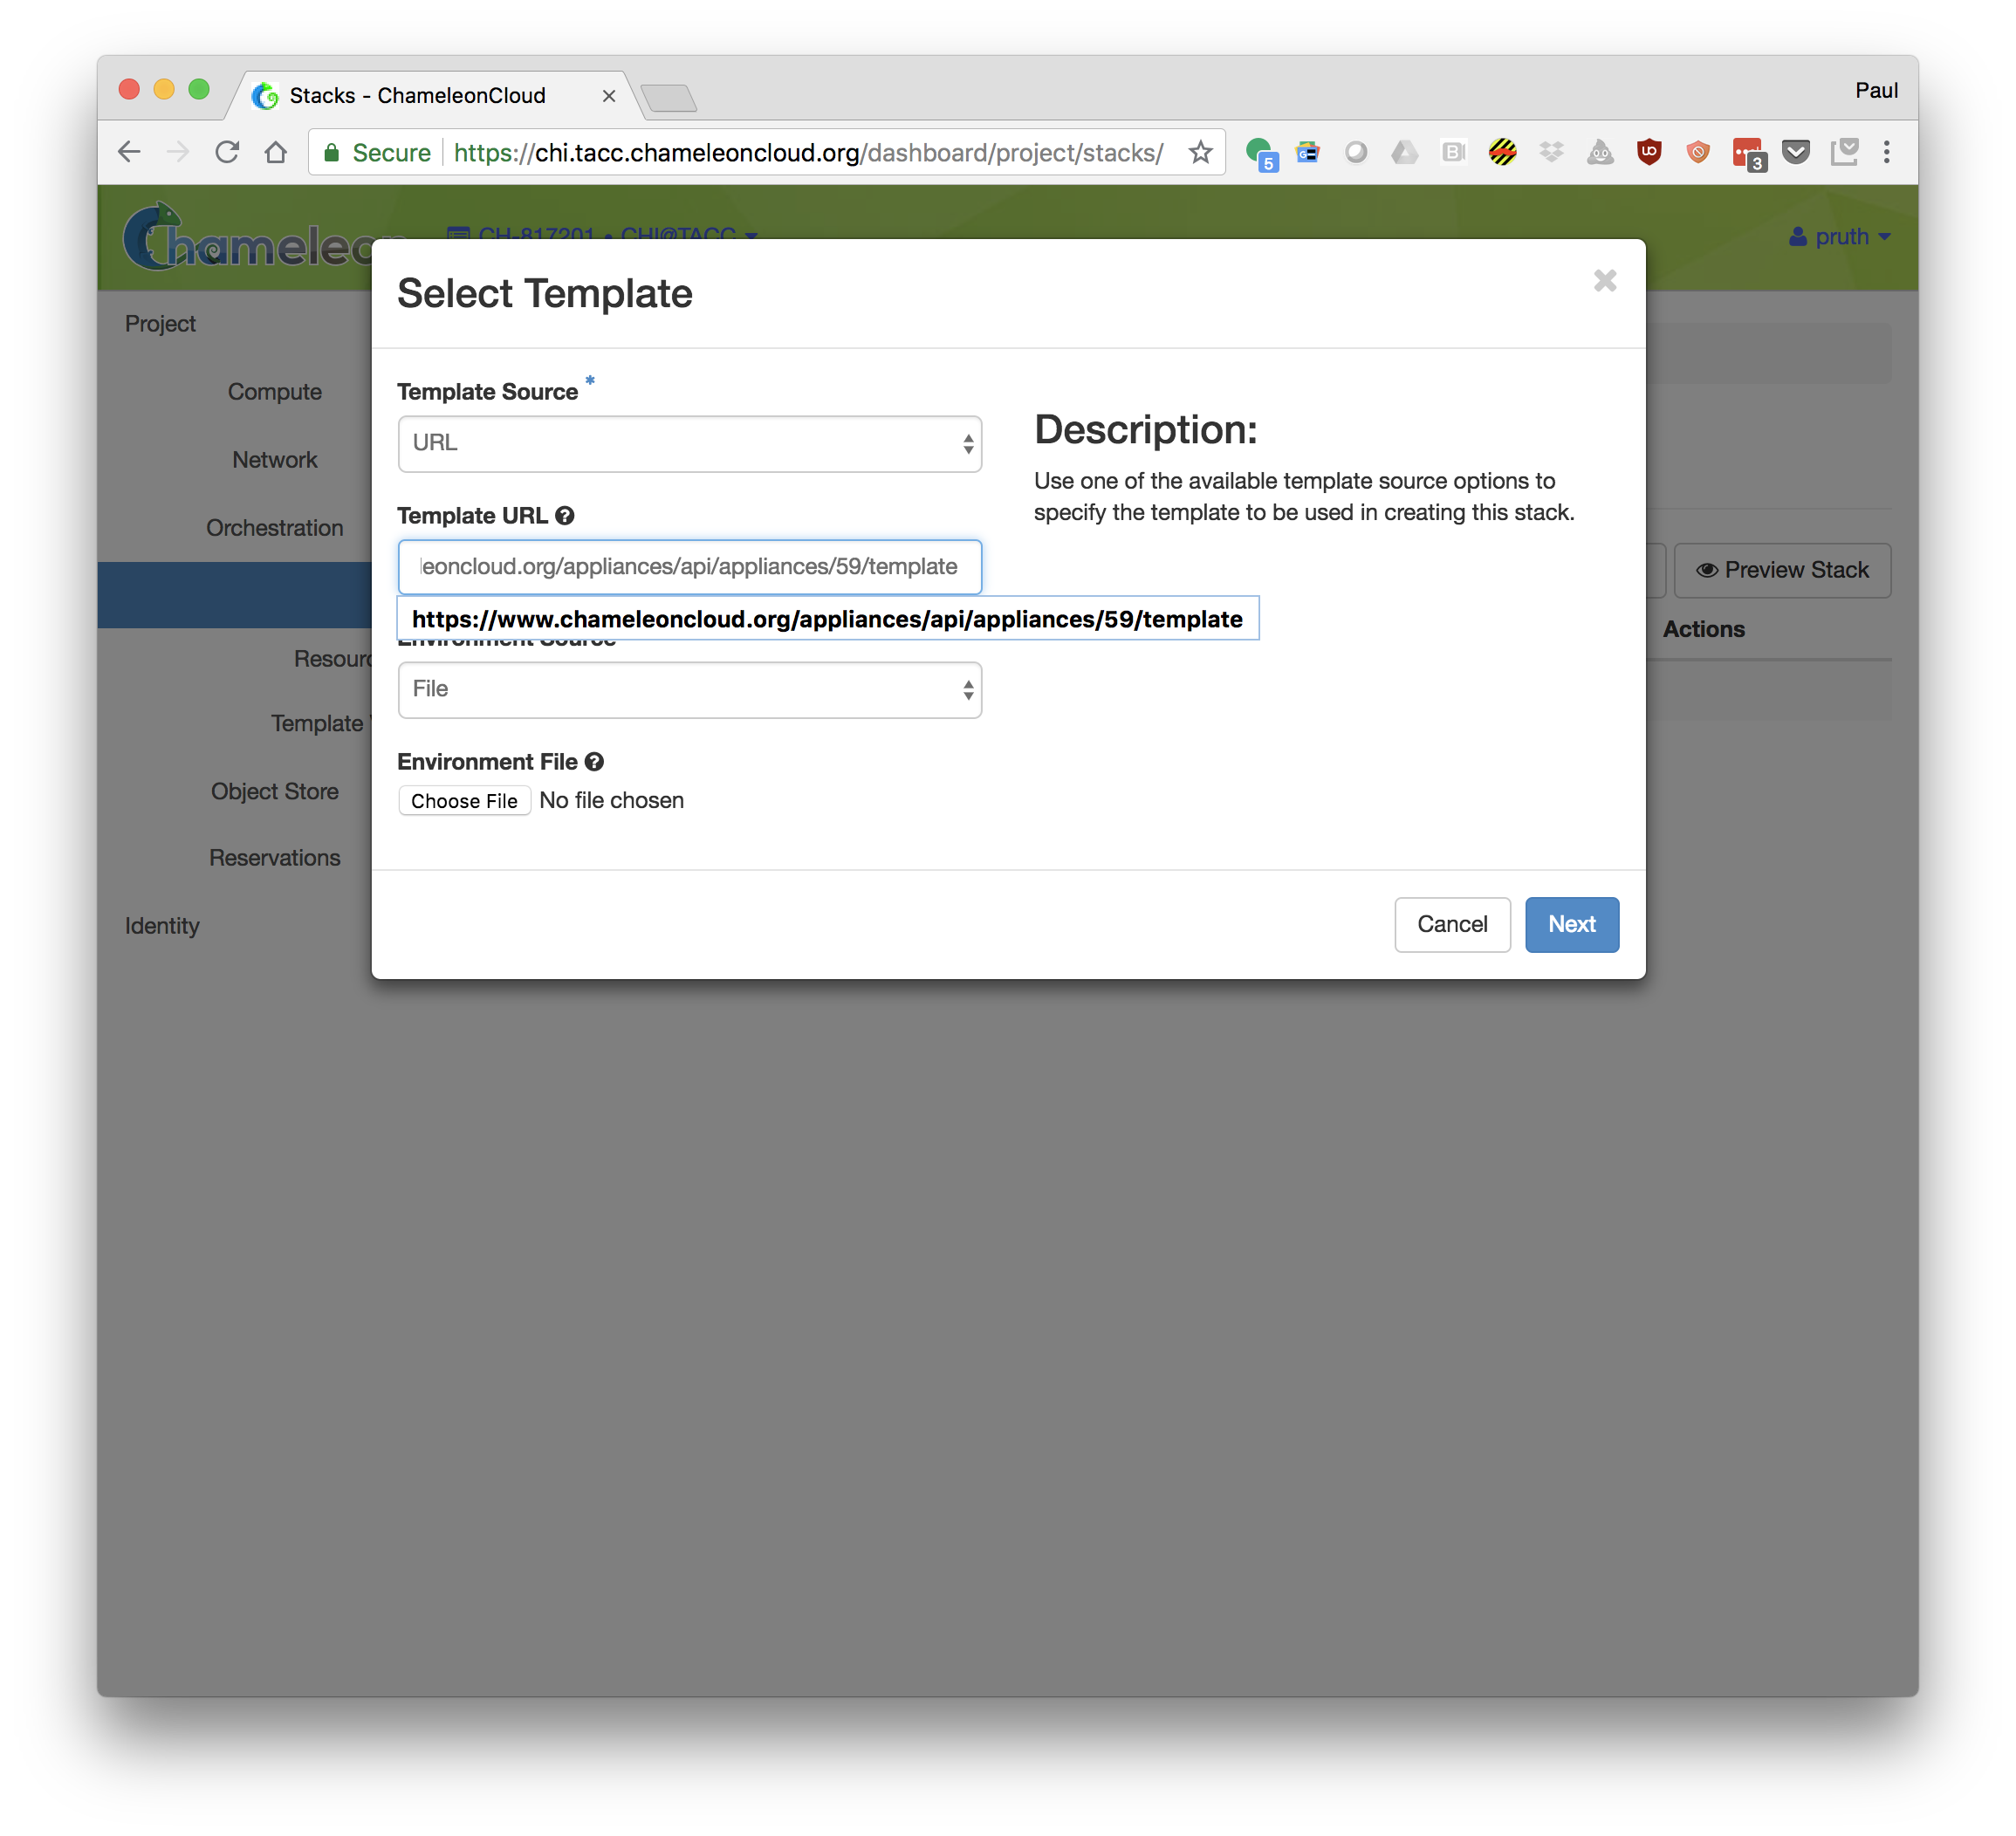
- Click "Launch Stack". Select Template Source: URL and Template URL: https://www.chameleoncloud.org/appliances/api/appliances/59/template
- Fill in the following properties for you stack:
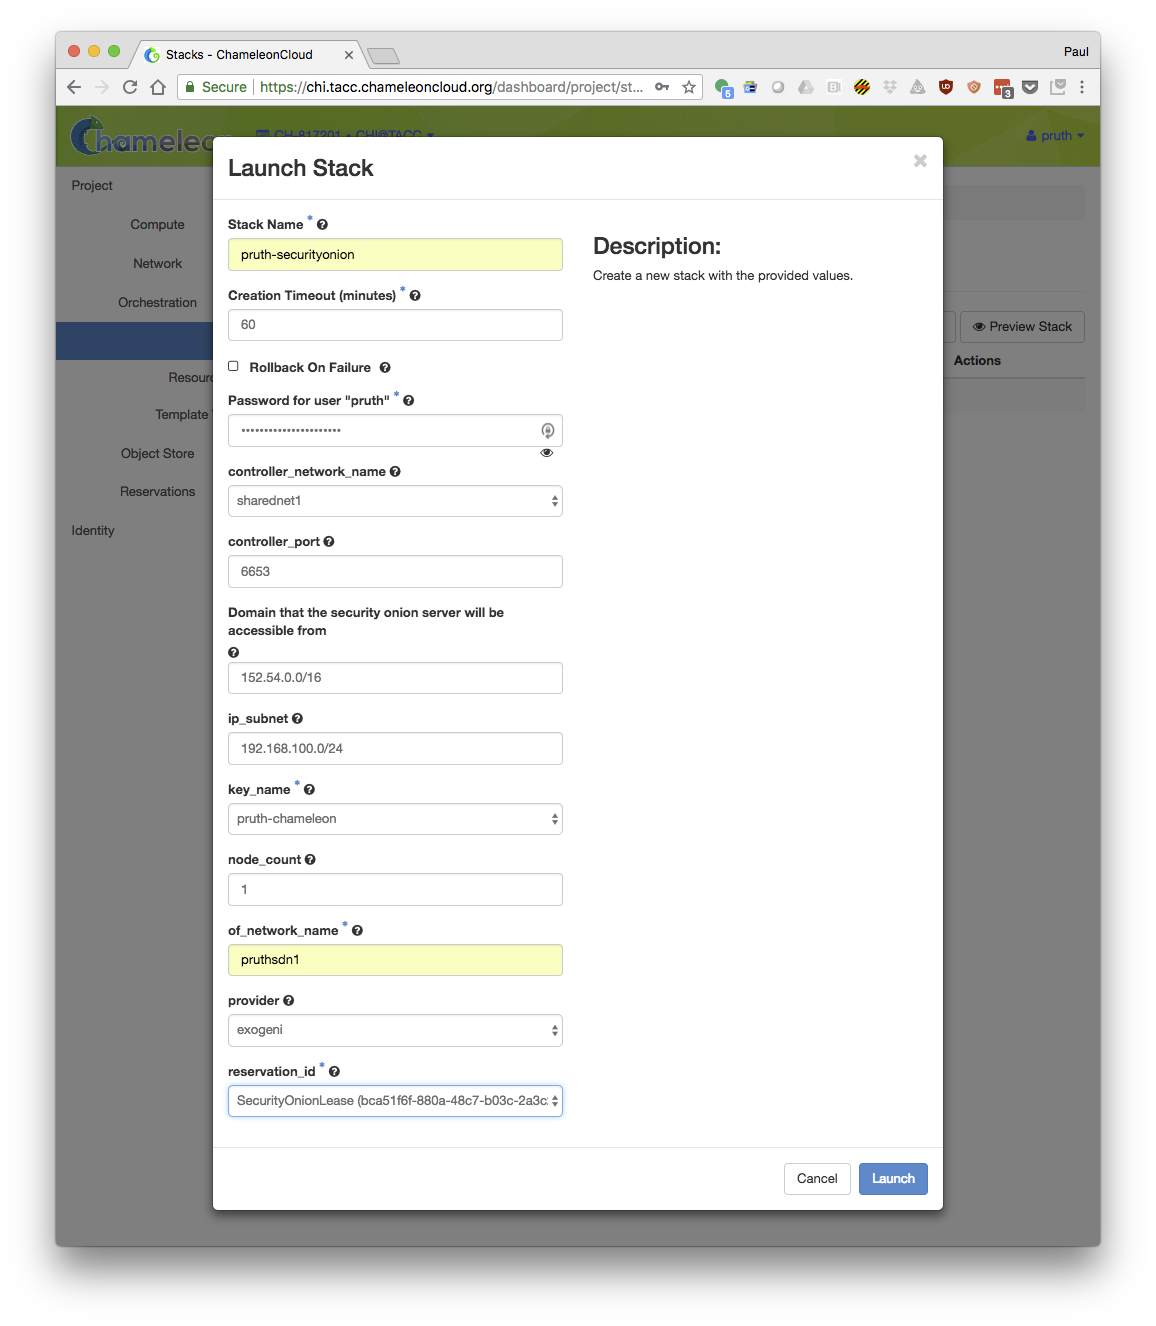
Stack Name: Choose a unique name for your stack (suggestion: include your login ID as part of the name)
Creation Timeout: 60 (default)
Password: Your Chameleon password
controller_nework_name: The name of the network for the OpenFlow controller. Set to "sharednet1"
controller_port: The port that the OpenFlow controller will use: Set to 6653 (default)
Domain that the security onion server will be accessible from: Set to your local subnet (i.e. the subnet used by your laptop or workstation)
ip_subnet: The subnet used by your nodes. The default will work.
key_name: The ssh key that you uploaded to Chameleon
OpenFlow Network Subnet (cidr): The user chosen subnet for the new OpenFlow network (example: 192.168.100.0/23)
node_count: The number of nodes that you want to monitor. Should be at least 2.
of_network_name: Choose a unique name for your OpenFlow network (suggestion: include you login ID)
provider: Set to "physnet1" for local networks (recommended) or "exogeni" for stitchable networks.
reservation_id: The reservation that will be used for the node. If you are participating in a formal tutorial the instructor may provide the reservation.
- Launch the stack.
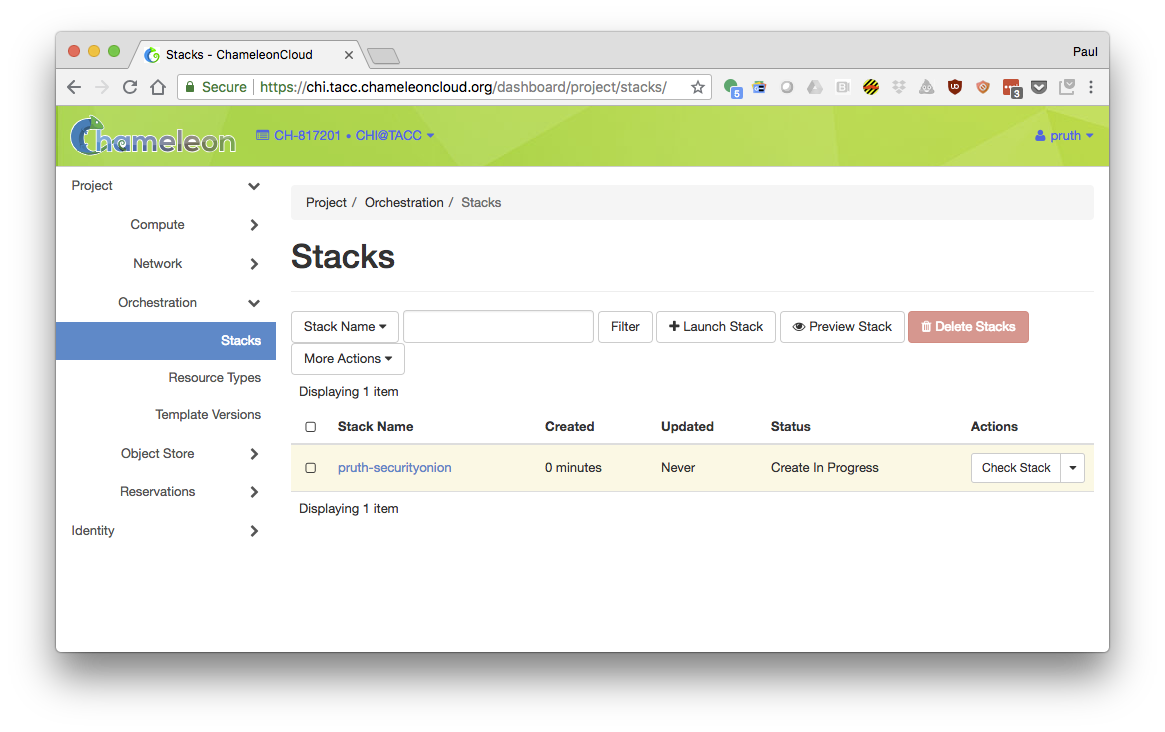
- Wait for the stack to be created.
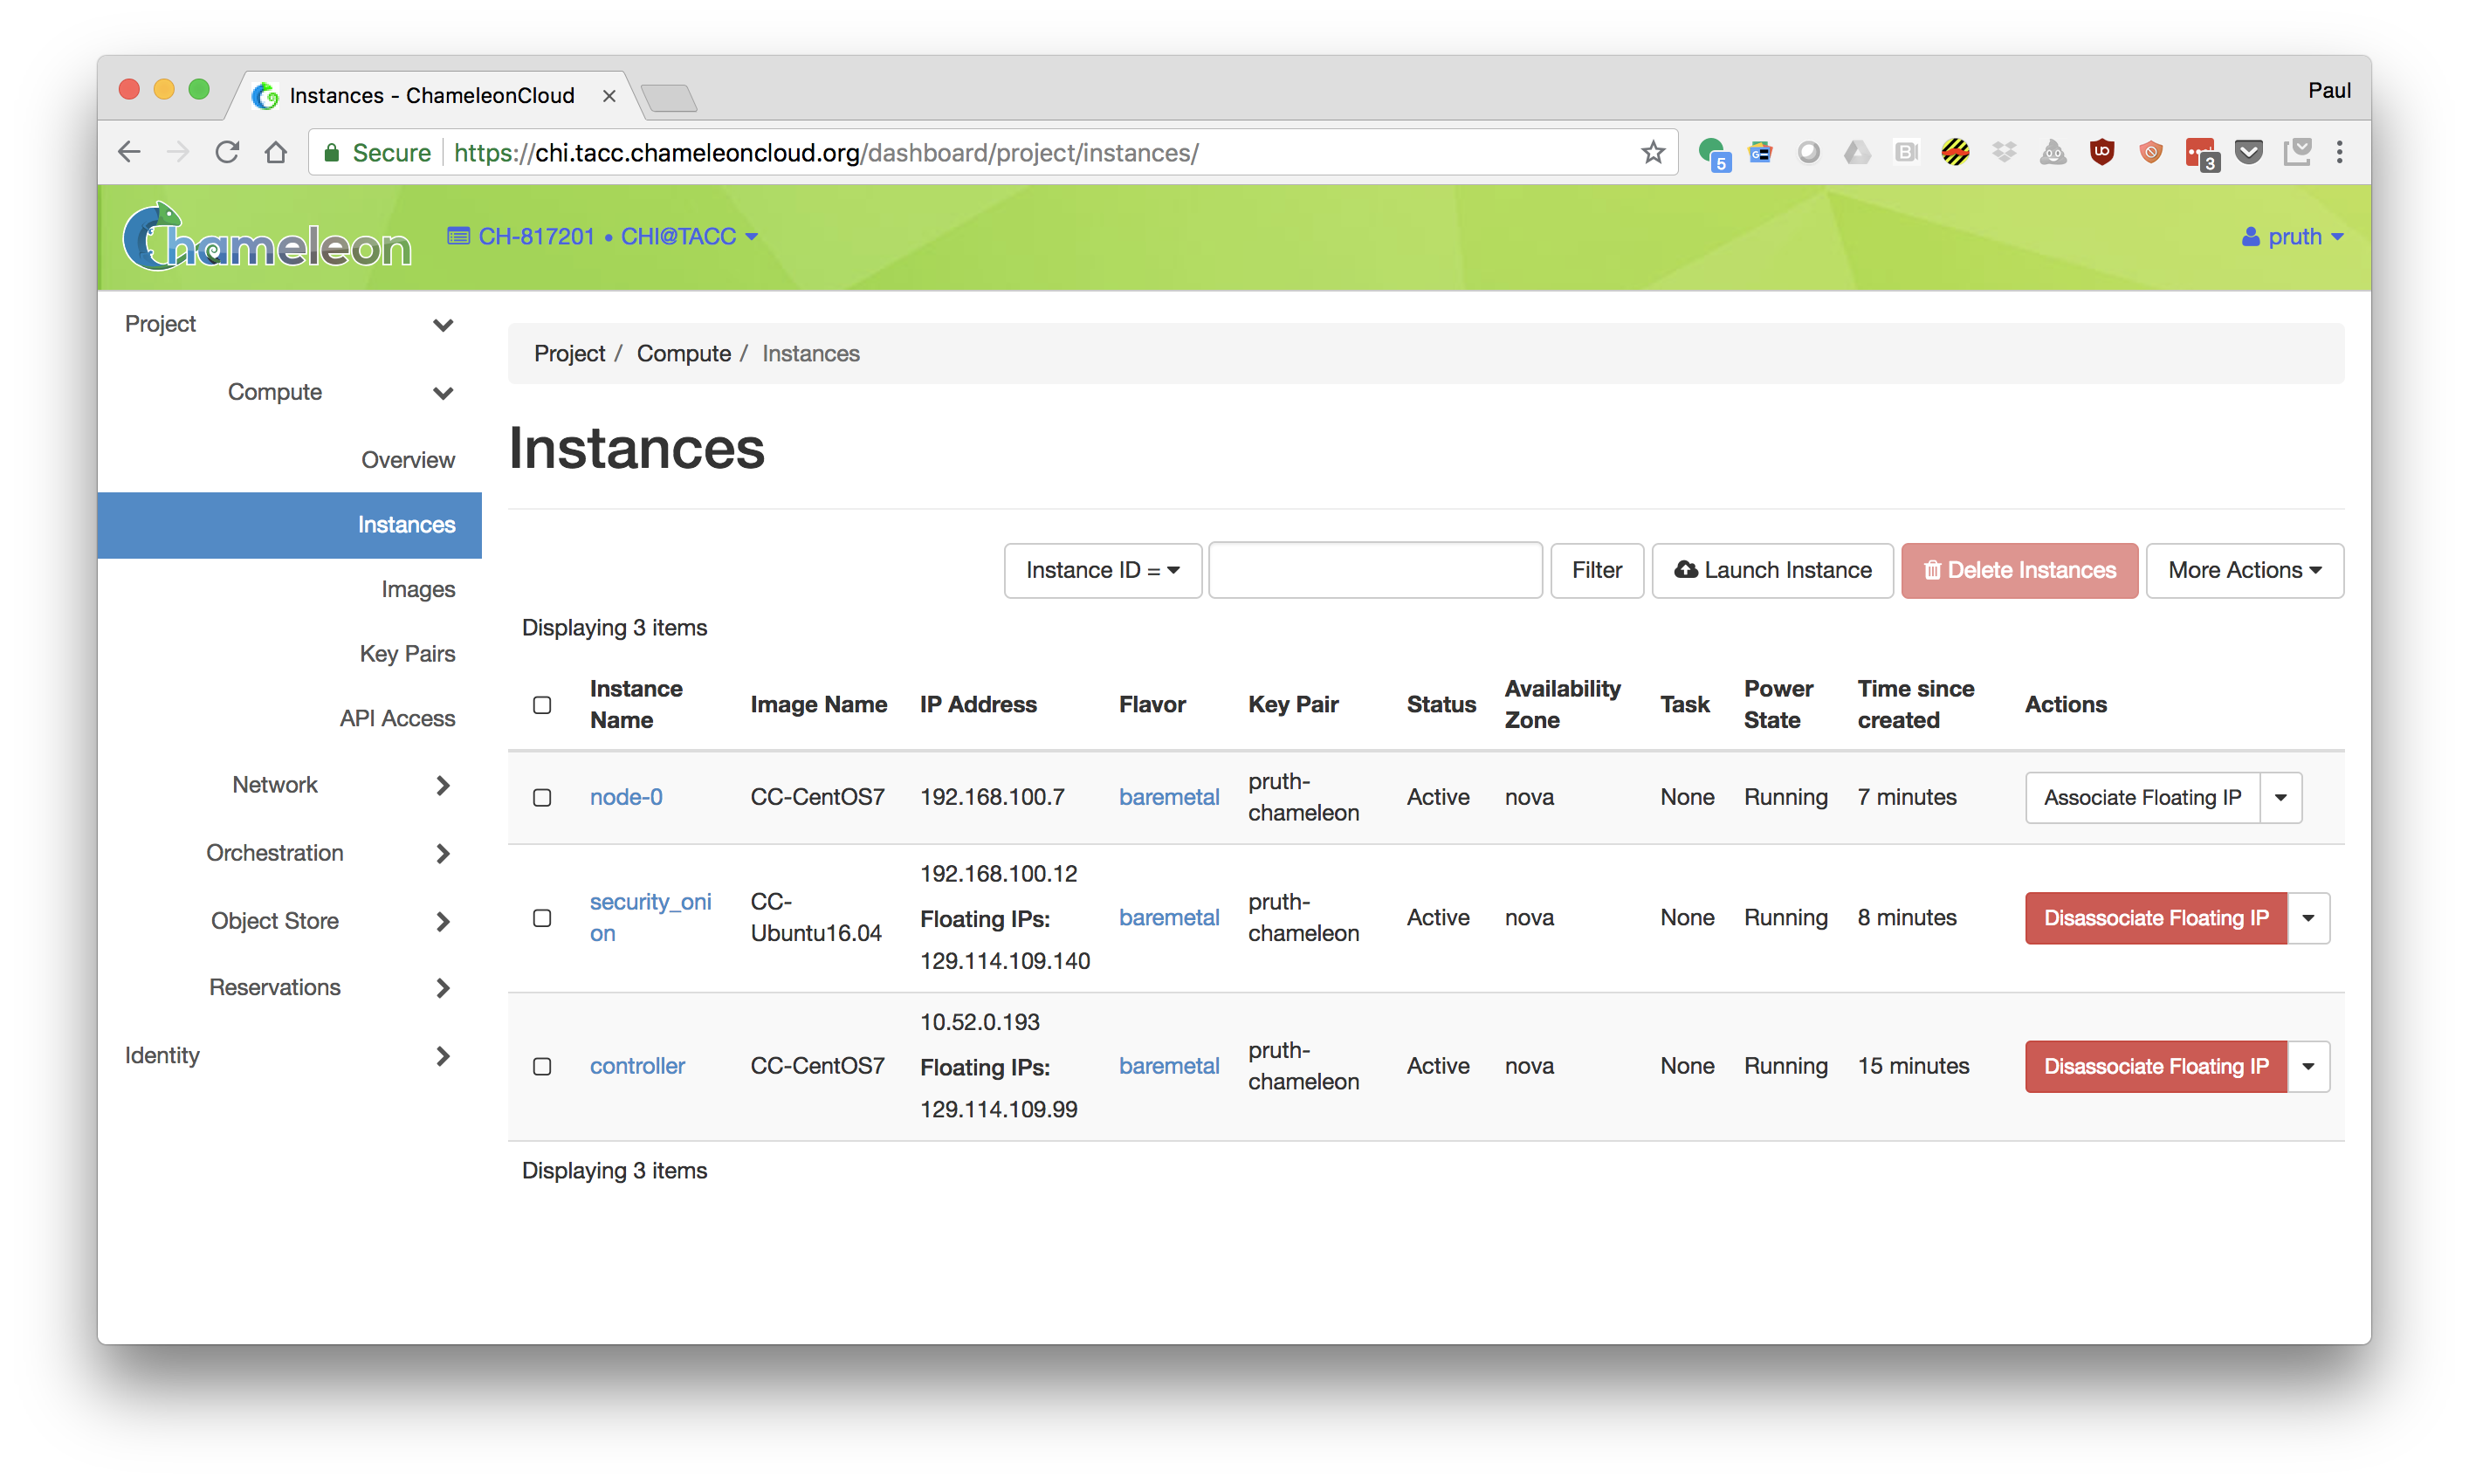
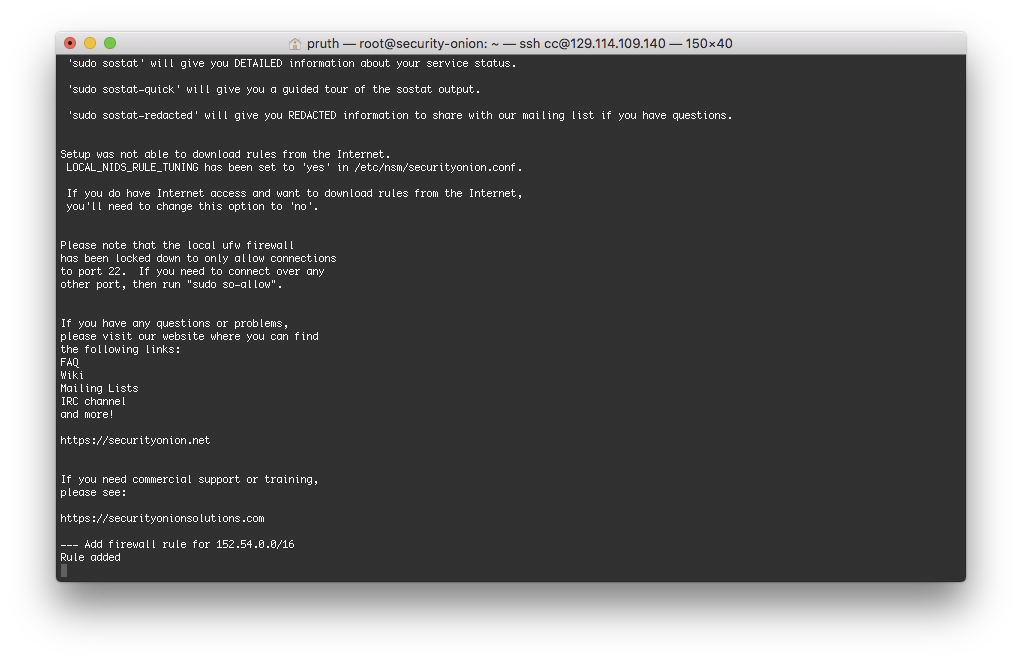
Hint: ssh to the security_onion node and, as root, tail -F /root/install_security_onion.log. The nodes are ready when the log reports that the firewall rule has been added.
Tutorial: Using Security Onion
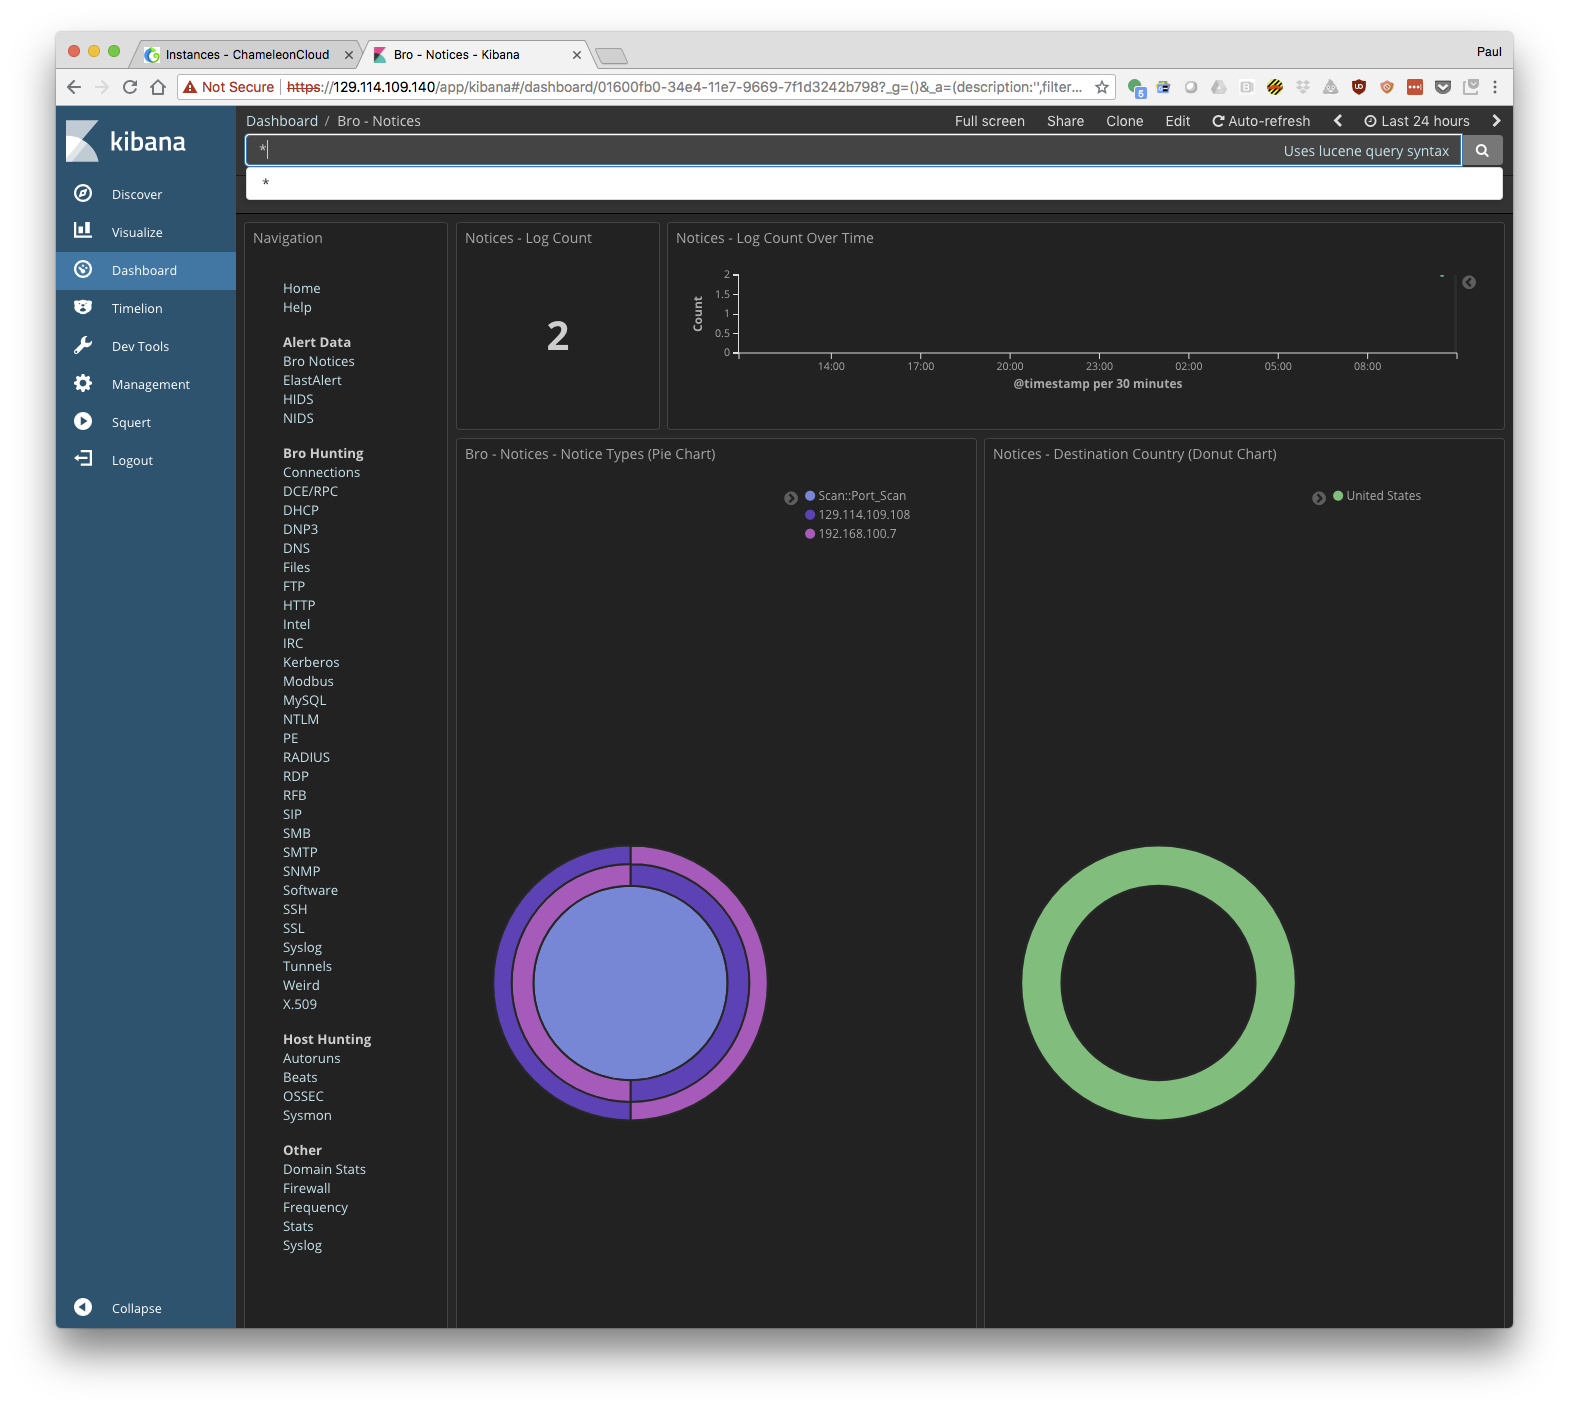
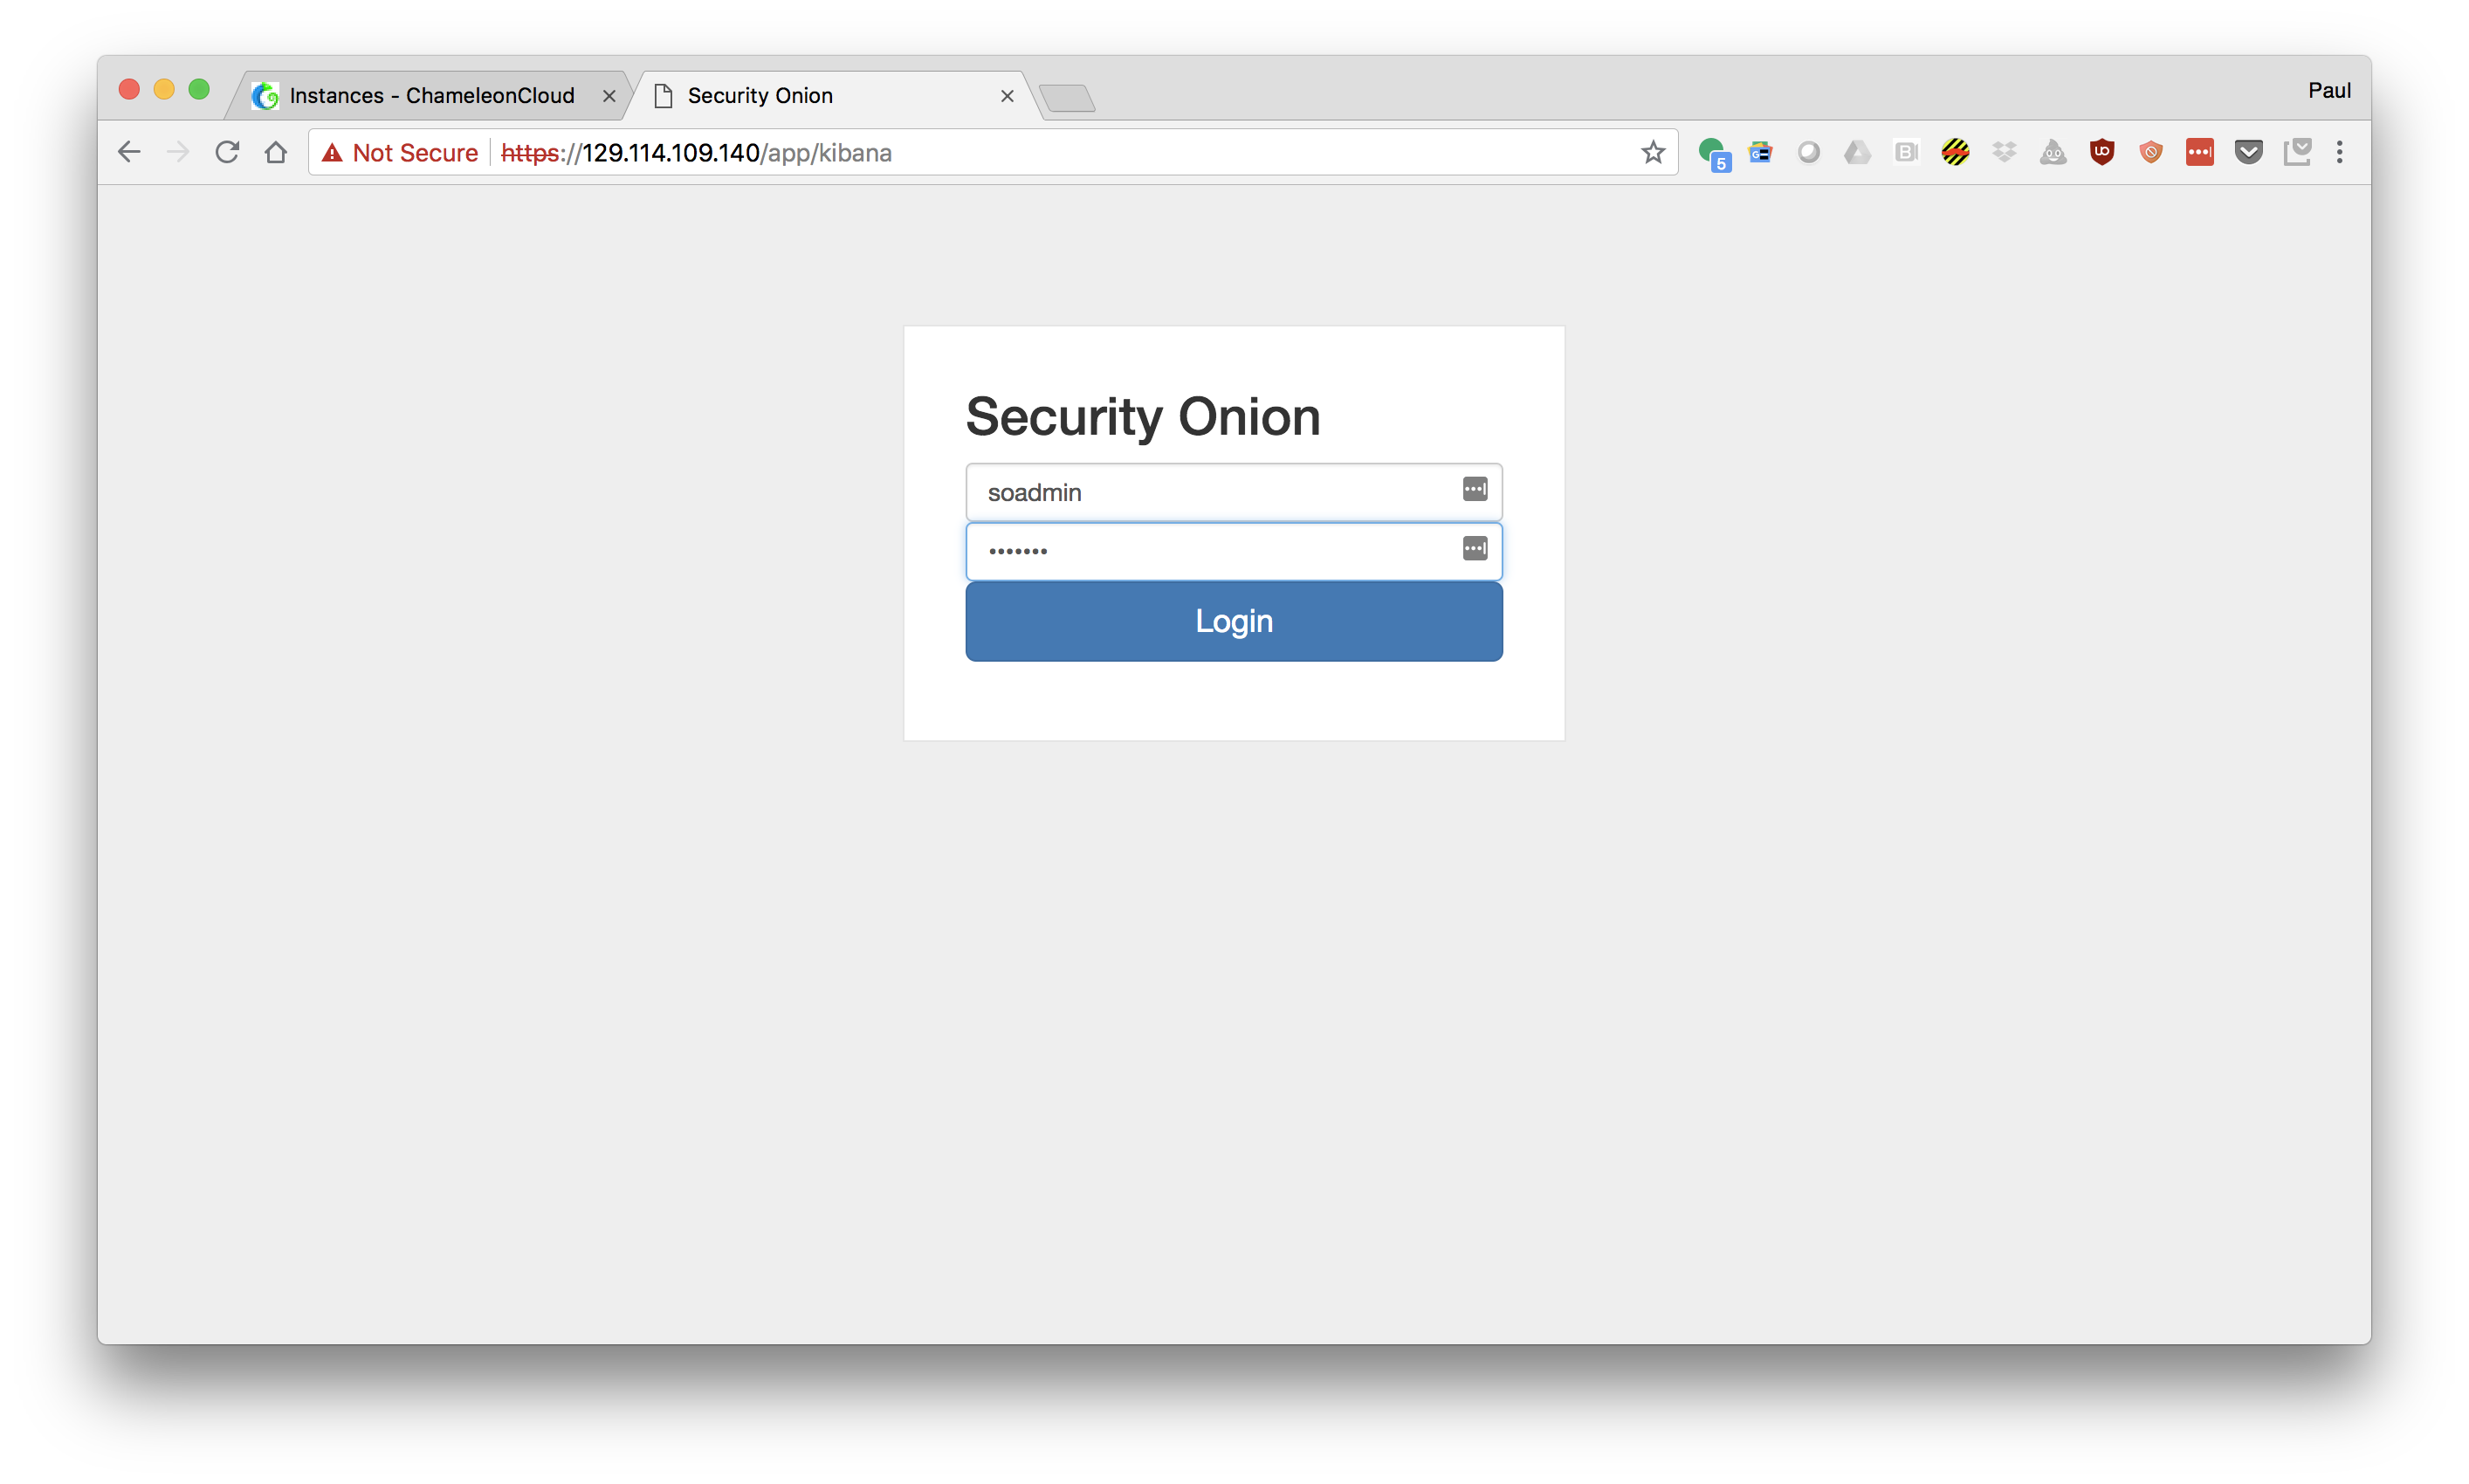
- Open a browser and go to: https://Floating IP of your Security Onion node

- Choose "kibana" and login with username and password "soadmin"
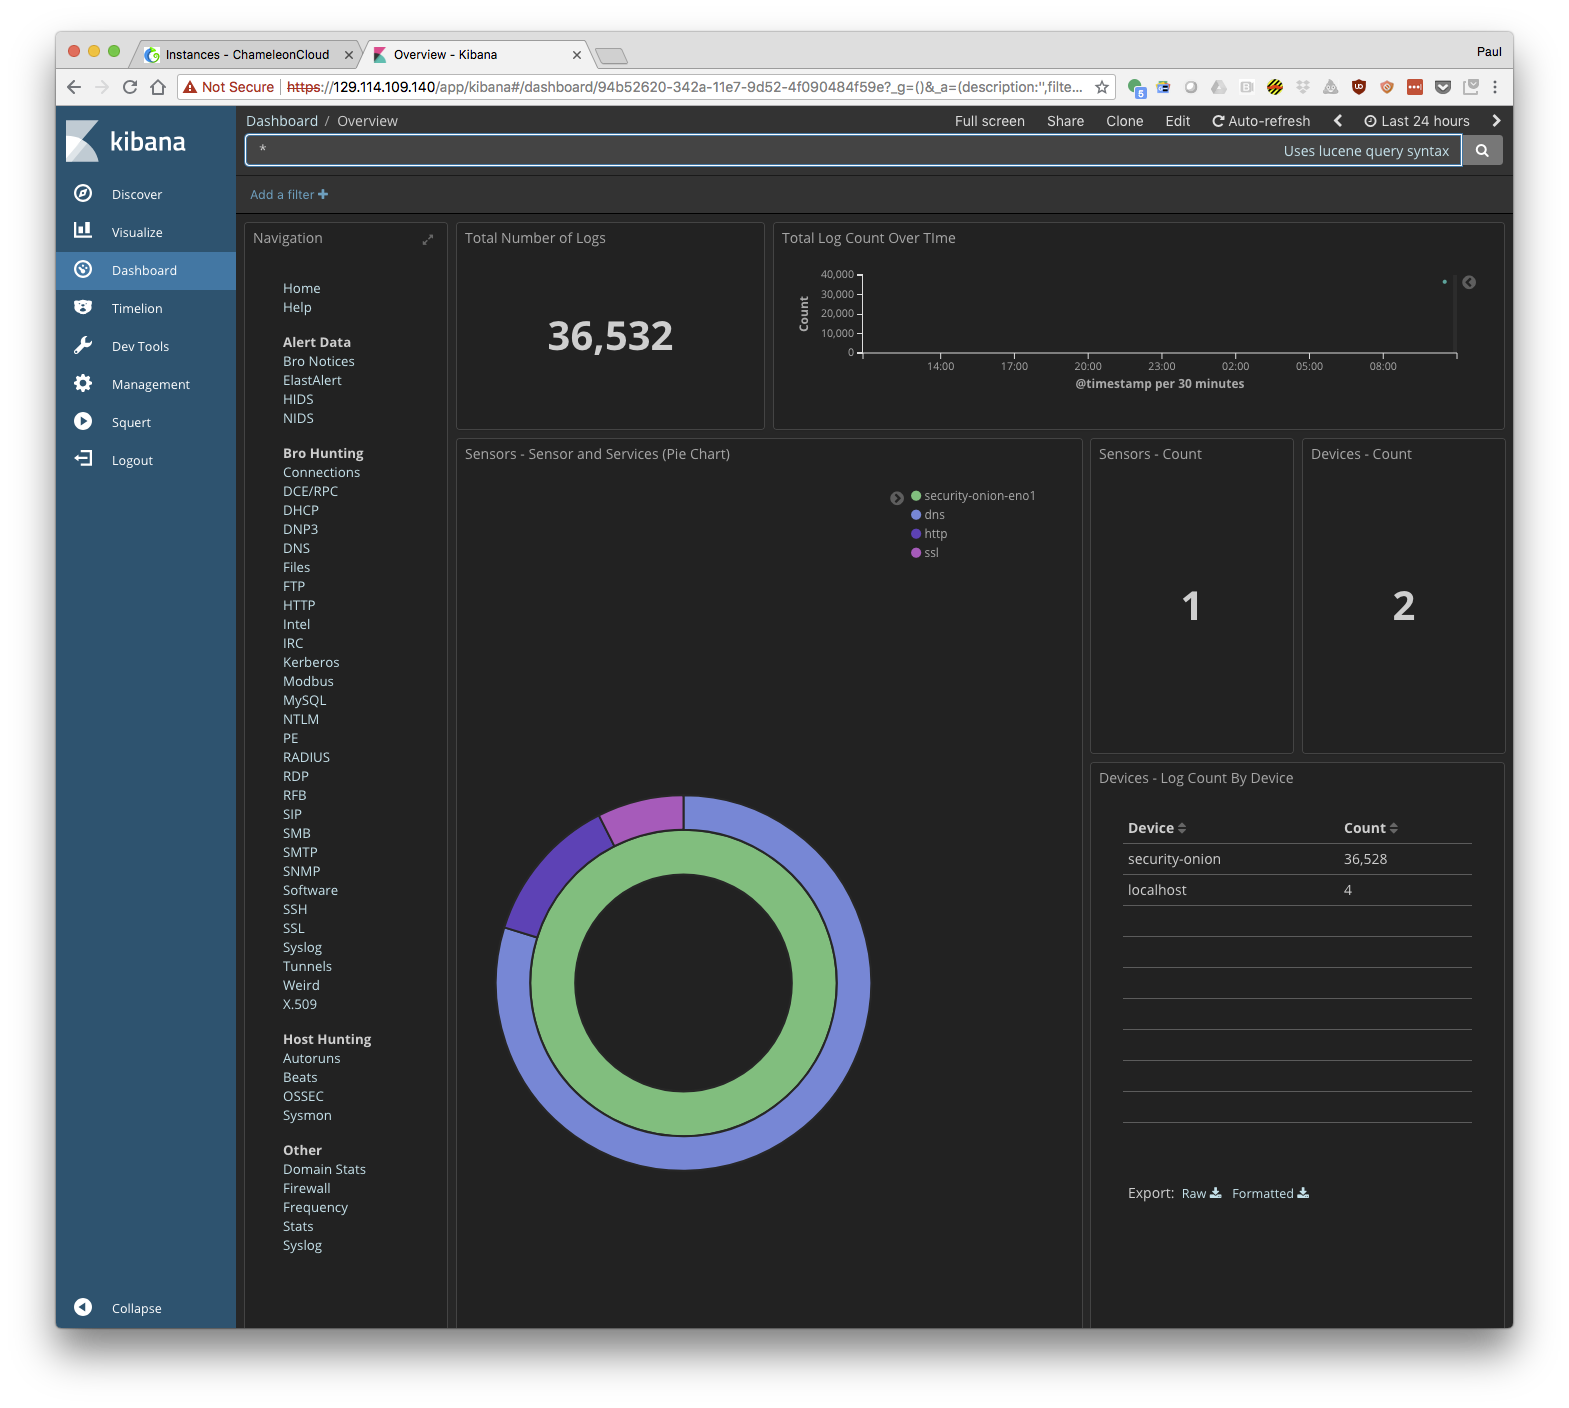
- Explore the monitoring information presented by kibana.
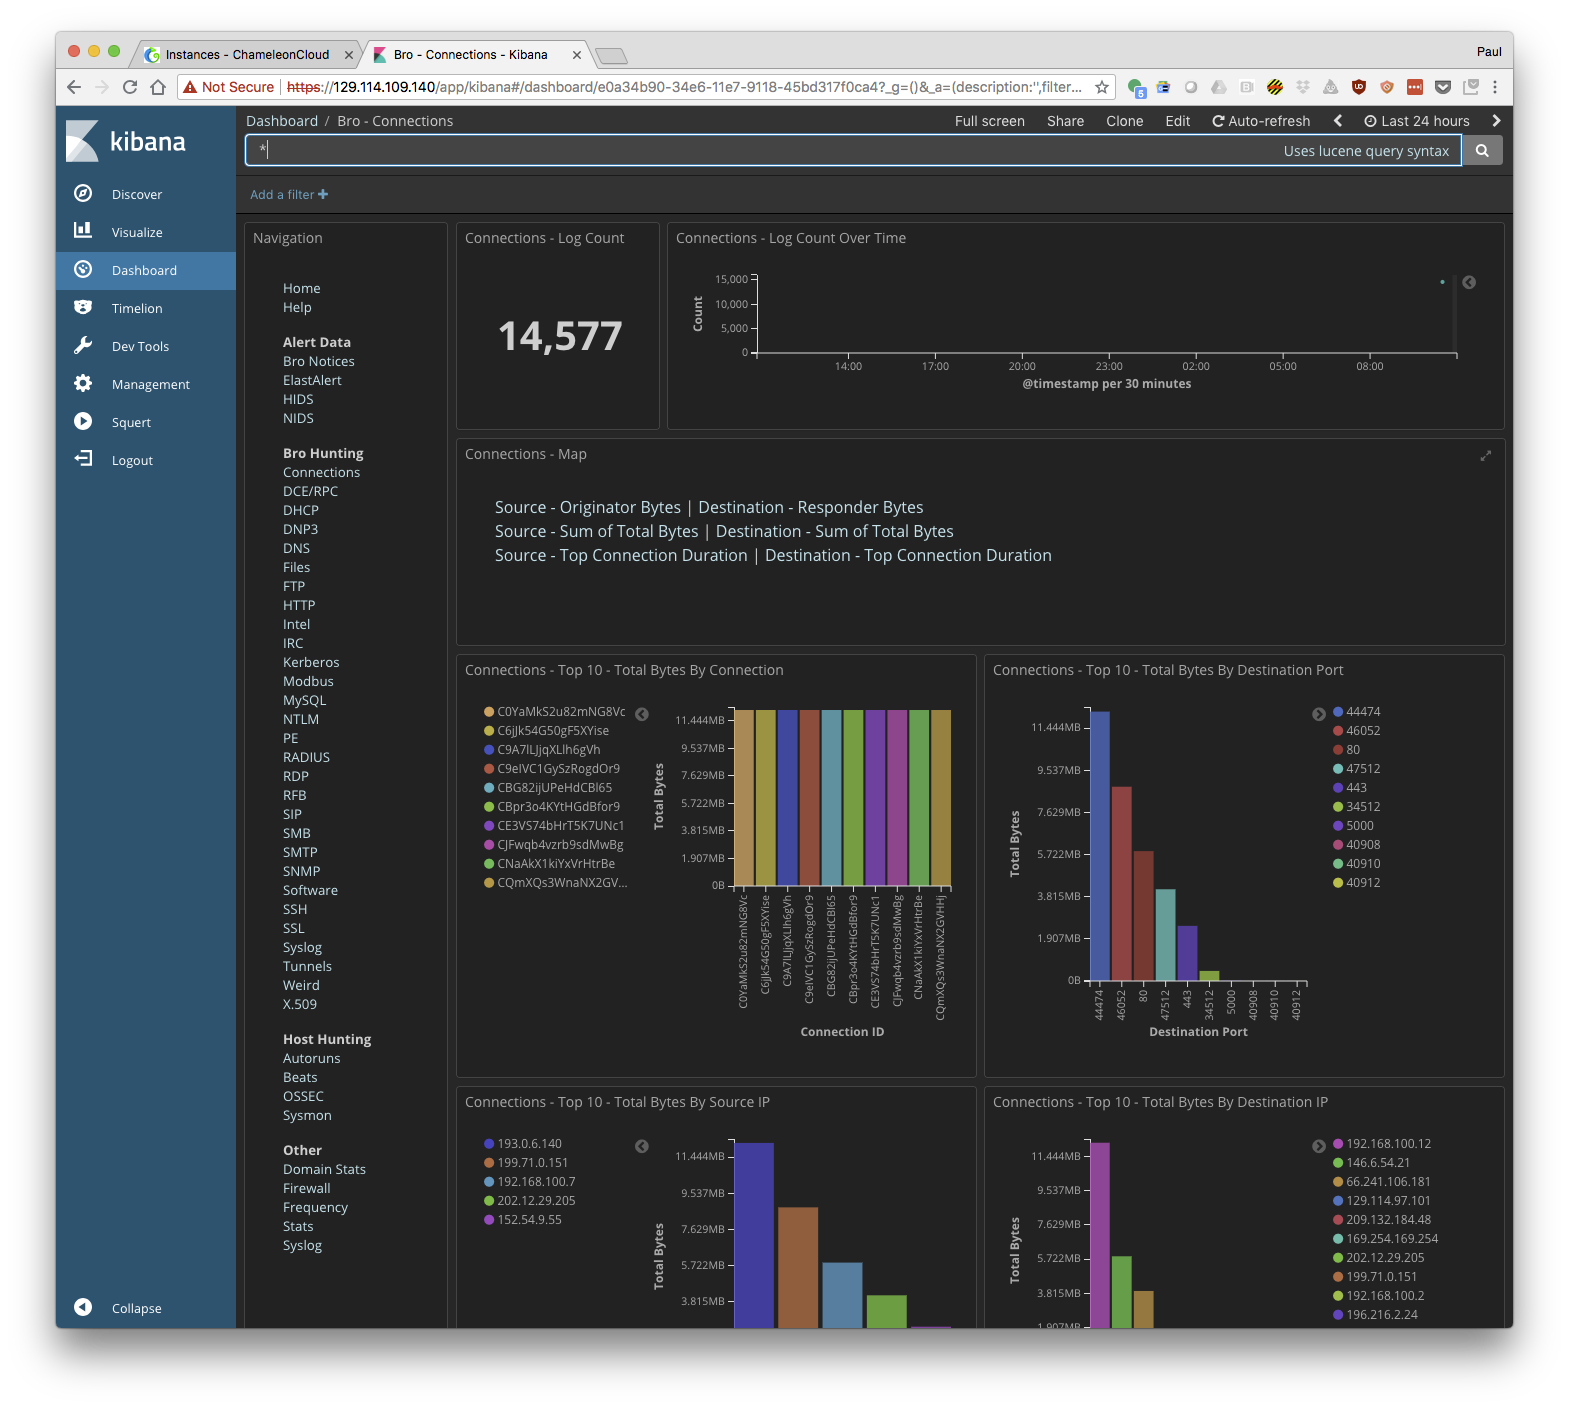
On interesting screen is "Connections" where you can see all the connections that have be made across the network you are monitoring. Can you find the http connection to your Security Onion node? Or maybe an ssh connection you made to one of your nodes?
Tutorial: Generate Traffic
- Add a floating IP to at least one of your additional compute nodes.
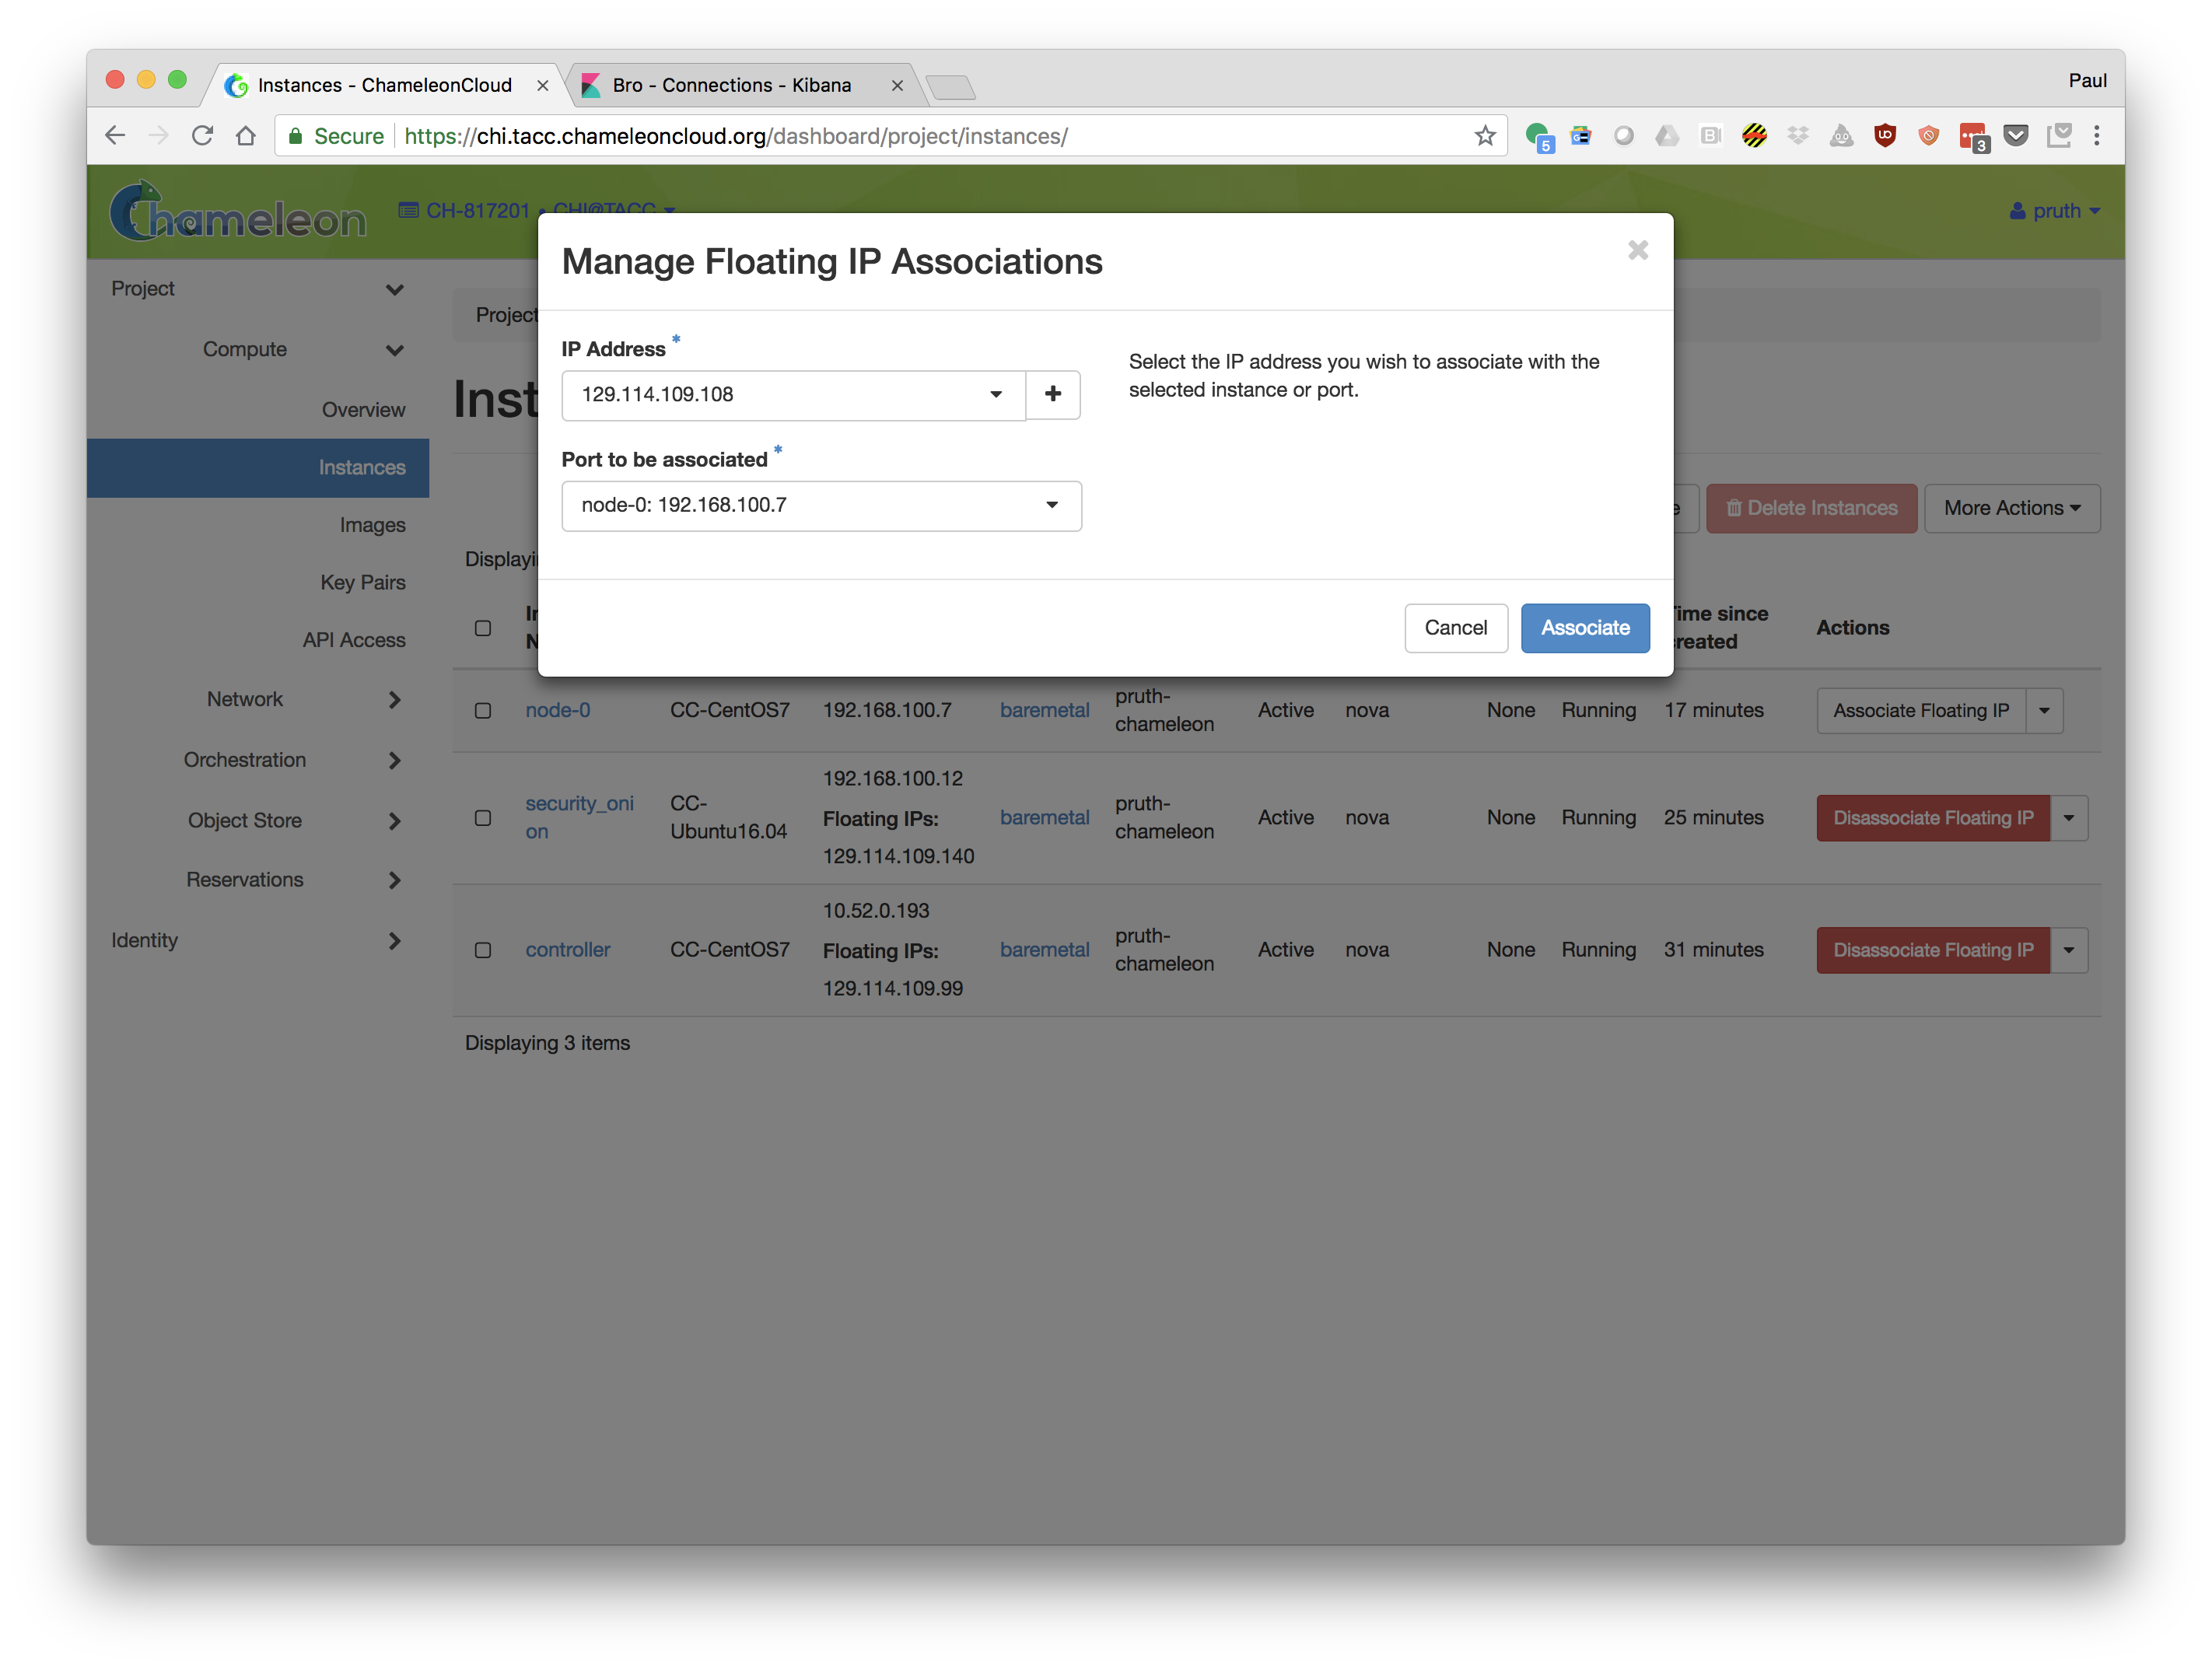
Use ping to send ICMP traffic from your laptop to the node.
Check the Security Onion interface to monitor the activity. Can you see your traffic in kibana's connection screen?
Try other protocols. Maybe use ssh to connect to your node.
Use nmap to port scan your node. You can do this from your laptop if nmap is installed. Otherwise you can log into your controller node and port scan from there.
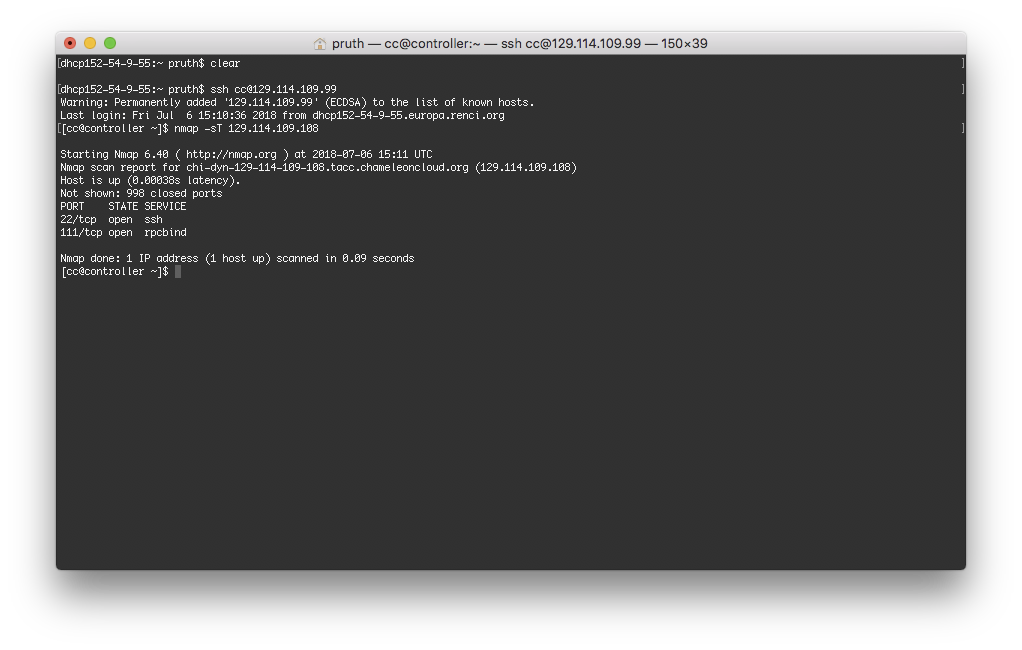
- Check the Security Onion interface to monitor the activity. Use the Bro Notices page to watch for port scan activity.
